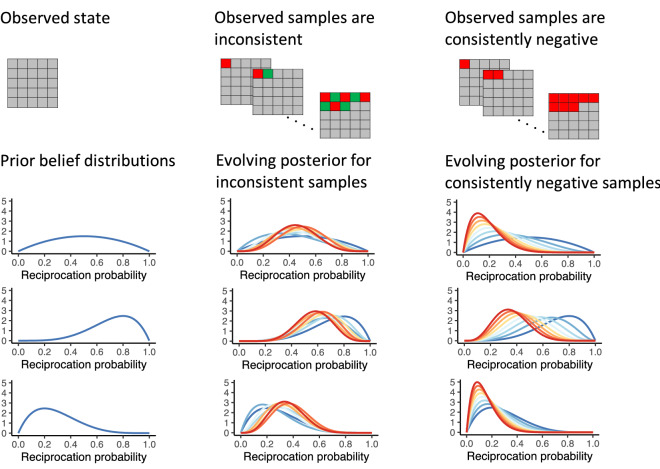
Figure 2.
Illustration of belief updates depending on the prior belief distribution and the consistency of sample outcomes. The first column shows three possible prior distributions, which represent the agent’s beliefs in the absence of observations (nothing is sampled yet). The second column represents a scenario in which eight samples were alternately red and green. The three plots show the evolution of the posterior (from blue to red) based on the samples and the prior in the first column. Third column: the same as the second column but for eight consistently negative (red) samples.

