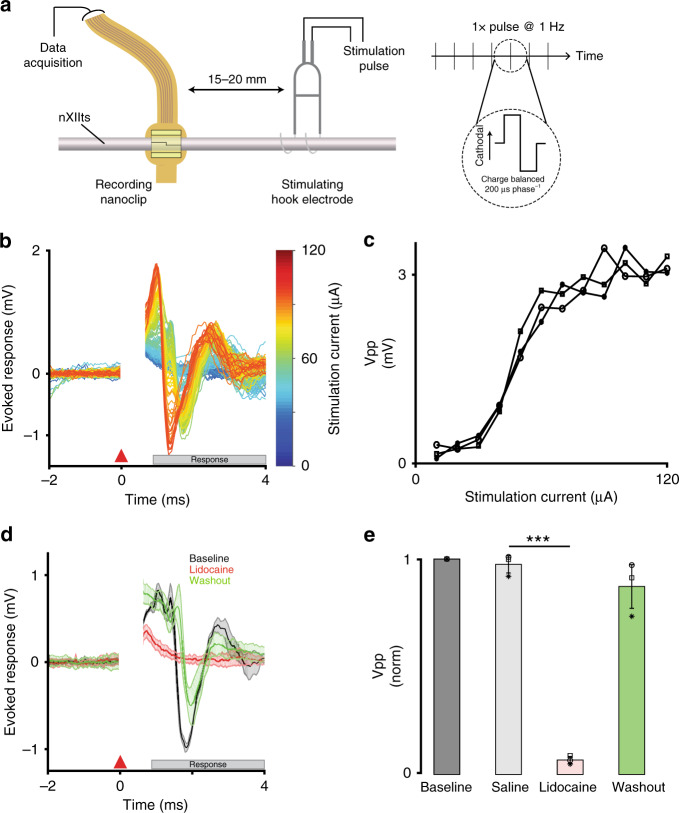
Fig. 3. Nanoclip-anchored thin-film arrays produce high-quality electroneurograms in acute preparations.
a Schema for acute recording of evoked compound action potentials. (Left) Current-controlled stimulation was delivered via bipolar silver hook electrodes; evoked responses were recorded by a nanoclip interface implanted 15–20 mm rostrally. (Right) Biphasic, cathodal-leading stimulating pulses, 200 μs phase−1 at 10–120 μA, were delivered at 1 Hz for 16–24 trials. b Example of graded evoked response to increasing stimulation intensities. Stimulation applied at t = 0 ms; stimulation artifact appears t = 0–0.5 ms; evoked response follows. c Evoked response peak-to-peak voltage (Vpp) showed an expected sigmoidal relationship with stimulation intensity. Each data point indicates the mean across trials within an animal (n = 3 birds; 16–24 trials each per stimulation intensity). Symbols identify individual birds. d Example of stimulation evoked responses recorded before, during, and after local lidocaine application. Each condition shows mean ± SEM (shaded) for n = 16 trials; all responses evoked at 64 μA. e Evoked response peak-to-peak voltage for different experimental conditions. Response amplitudes were normalized to baseline condition to facilitate comparison across n = 3 animals. Each data point indicates the mean across 16 trials within an animal; symbols identify individual birds. Bars and error bars denote mean ± SEM across n = 3 birds per condition. Repeated-measures ANOVA, P = 0.003; Dunnett’s test P = 6 × 10⁻⁶. ***P < 0.001. Source data are provided as a Source Data File.

