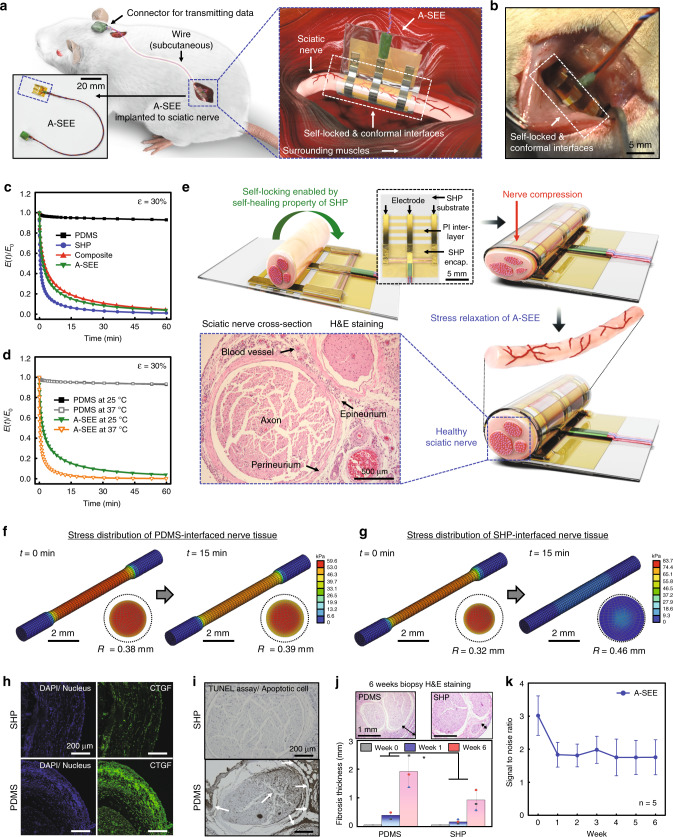
Fig. 1. A-SEE and its nerve tissue modulus adaptability.
Schematic (a) and photograph (b) show the A-SEE interfaced with a rat sciatic nerve. c Time-dependent normalized tensile stress relaxation of different materials at 30% strain. d Temperature dependence of stress relaxation in PDMS and A-SEE. e Schematic and H&E stained image of rat sciatic nerve tissue showing the effect of tissue modulus-adaptability of A-SEE on the nerve. Representative image from n = 3 biologically independent samples. FEA results showing the time-dependent distributions of compressive stress applied to the nerve interfaced with PDMS (f) and SHP (g). Confocal fluorescence (h) and TUNEL staining (i) images of sciatic nerve cross-sections. Representative images from n = 3 biologically independent samples. j, Thickness of fibrotic tissue formed around the nerve tissues interfaced without (week 0) and with PDMS or SHP for 1 and 6 weeks. Statistical analysis was performed using one-way analysis of variance (ANOVA) with Tukey’s multiple comparison test (n = 3 independent samples for each group, P(Week 1) = 0.0097, P(Week 6) = 0.0104, *P < 0.05). Top inset shows H&E stained images showing the fibrotic tissue formed around the nerve tissue. Representative images from n = 3 biologically independent samples. k SNR of sensory neural signals recorded by the A-SEE for 6 weeks (n = 5 independent animals). In, j, k, all data are represented as mean ± S.D. Source data are provided as a Source Data file.

