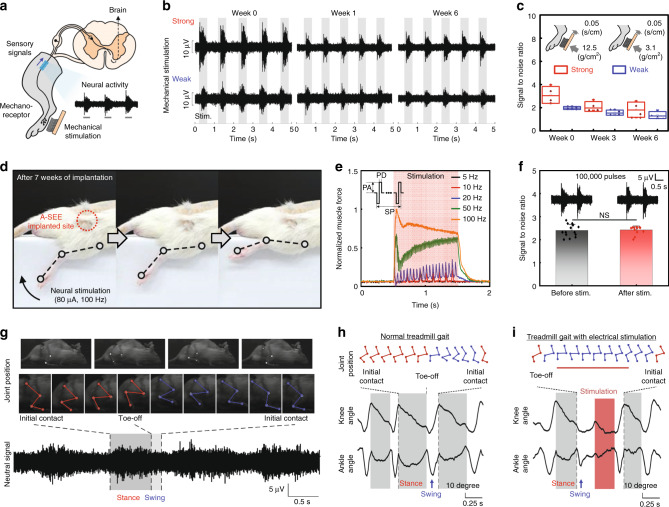
Fig. 3. Chronic neural recording and stimulation using the A-SEE.
a Schematic of sensory neural signal recording during mechanical stimulation. b Long-term neural signal recordings with strong and weak mechanical stimuli. c SNR of neural signals with strong and weak stimuli at 0, 3, and 6 weeks of implantation (n = 5 independent experiments). The centerline represents the median, the bounds of the box represent the upper and lower quartiles, the whiskers represent minimum and maximum values, and the hollow circle shows dot plots. Error bars represent S.D. d Sequential images for hind limb movement induced by electrical stimulation (80 μA, 100 Hz) at 7 weeks of implantation. e Plot of normalized muscle force as a function of stimulation frequency. The parameters involved in neural stimulation are pulse width (PW, 0.25 ms), biphasic pulse amplitude (PA, 80 μA), stimulation period (0.5 s), repetition stimulation periods (SP, 5, 10, 20, 50, and 100 Hz), and stimulation current (1.14 μC/cm2). f Changes in SNR performance before and after electrical stimulation (stimulation pulses: 100,000). Data are represented as mean ± S.D. Statistical analysis was performed using one-way ANOVA with Tukey’s multiple comparison test (n = 14 independent experiments, P = 0.7795, NS (not significant) P > 0.05). g Synchronous neural signal and joint position recording of treadmill gait after 7 weeks of implantation. Real-time analysis for joint position and knee/ankle angle changes of a live rat without (h) and with (i) electrical stimulation after 7 weeks of implantation. Source data are provided as a Source Data file.

