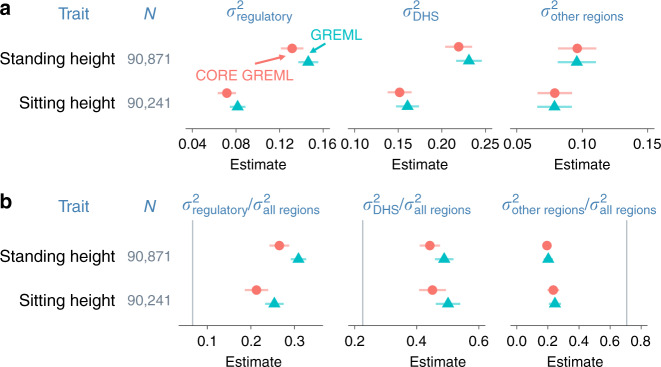
Fig. 6. Variance estimates from genomic partitioning analyses.
Three functional regions of the genome are regulatory regions, DNase I hypersensitivity sites (DHS), and all other regions. N = sample size; , , and denote phenotypic variances explained by the three functional regions. Model parameters were estimated using the traditional method, i.e., GREML, and the proposed method, i.e., CORE GREML. a Variance-component estimates. b Estimated proportions of total genetic variance attributable to three functional regions of the genome. Error bars are 95% confidence intervals (based on s.e.m.). Vertical lines in b are percentages of SNPs from the three functional regions; conceptually, they are expected proportions of total genetic variance explained by the three functional regions of the genome assuming all genome-wide SNPs have an equal contribution to phenotypic variation. Residual variance estimates are omitted for simplicity. Source data are provided as a Source Data file.

