
Figure 1.
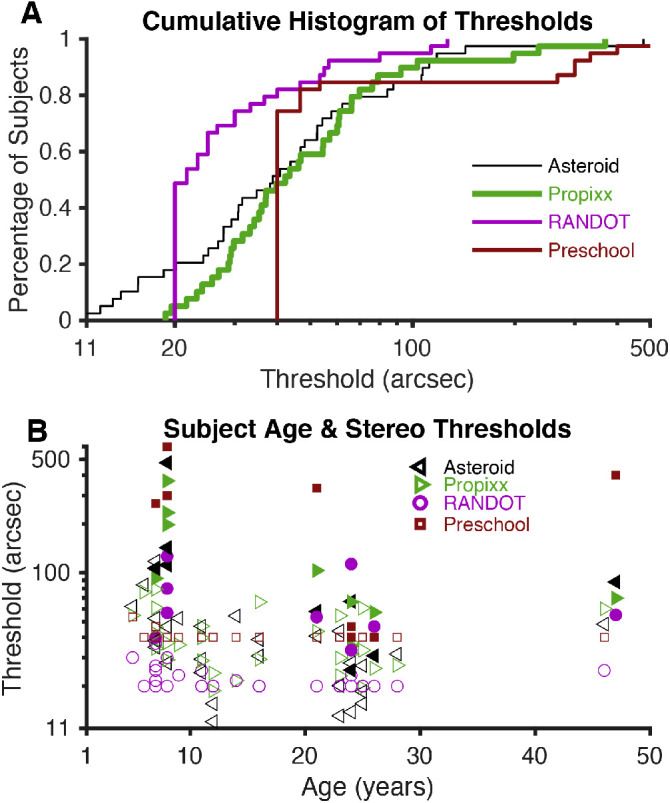
Stereo thresholds. (A) Plots of the stereo thresholds for all 39 subjects, as determined by each test (geometric mean of three thresholds for each subject), as cumulative histograms. The two subjects who did not return for follow-up visits are included, but the data were averaged over two measurements instead of three. (B) Plots of the stereo thresholds for each subject as a function of his or her age. Filled shapes represent stereo-abnormal subjects; non-filled shapes represent stereo-normal subjects.