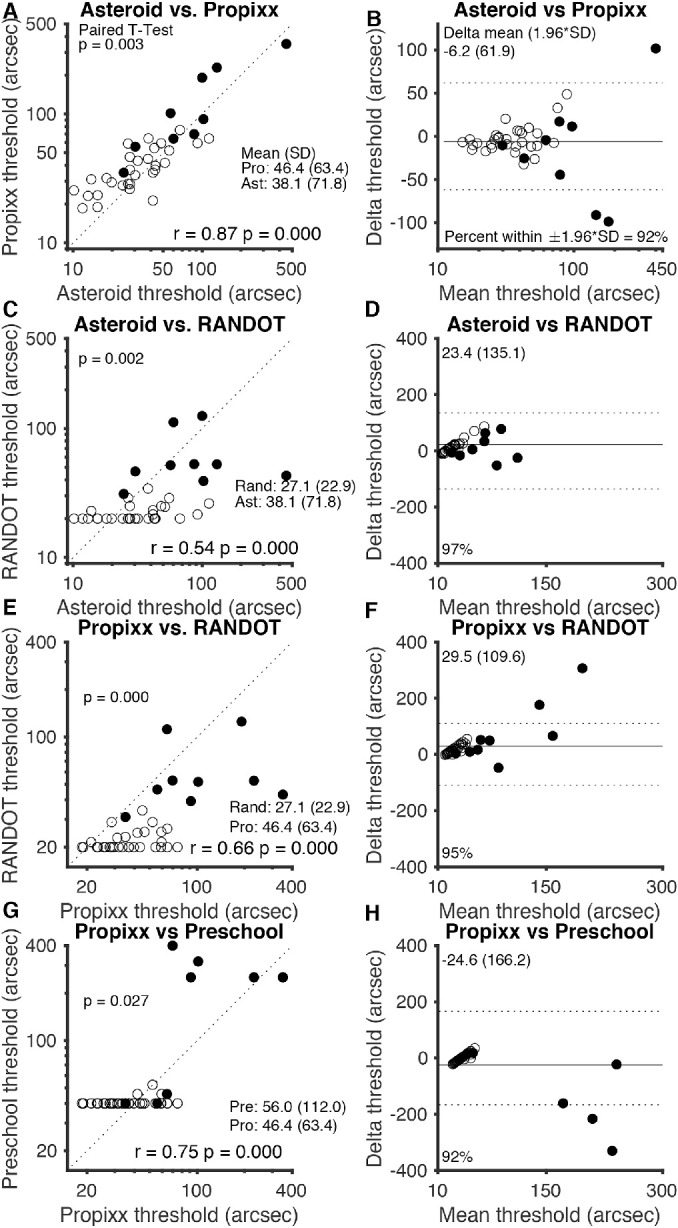
Figure 3.

Comparison of stereo tests. (A, E, G) Graphs on the left side of the figure plot thresholds of each clinical test (ASTEROID, Randot Circles, and Randot Preschool) against thresholds for the research standard (PROPixx) test. (C) Plot of ASTEROID against the commonly used Randot Circles stereotest thresholds; a dotted line representing perfect agreement is plotted on each graph. (B, D, F, H) Bland–Altman plots on the right side of the figure show mean delta (solid line) and 95% limits of agreement (dotted lines) for each comparison. The geometric means of the three time points of data collection for each subject were used for this analysis; the geometric means and traditional standard deviations are listed for each stereotest. The two subjects who did not return for follow-up visits are included but data were averaged over two measurements instead of three. Filled shapes represent stereo-abnormal subjects; non-filled shapes represent stereo-normal subjects.
