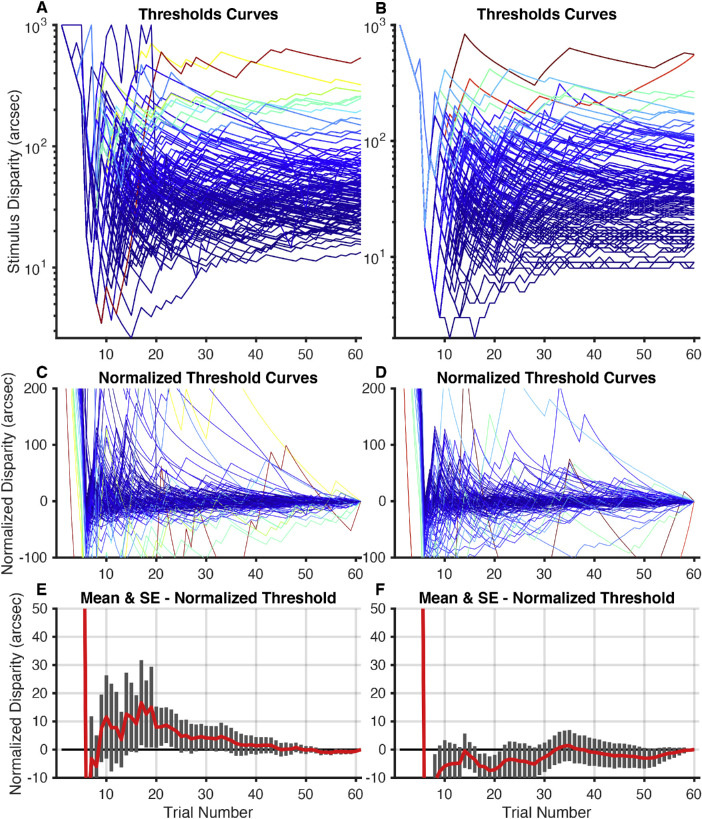
Figure 4.
PROPixx and ASTEROID threshold curves. (A) PROPixx and (B) ASTEROID threshold curves (115), defined as current estimated threshold at each trial, one for each time each subject completed each test. Each colored line represents one test completion. (C) PROPixx and (D) ASTEROID normalized threshold curves (115), normalized to the threshold value determined by the 60th and final trial. (E) PROPixx and (F) ASTEROID means and standard errors of normalized threshold values for each subject at each trial. The five practice trials with monocular cues are not included in these curves.

