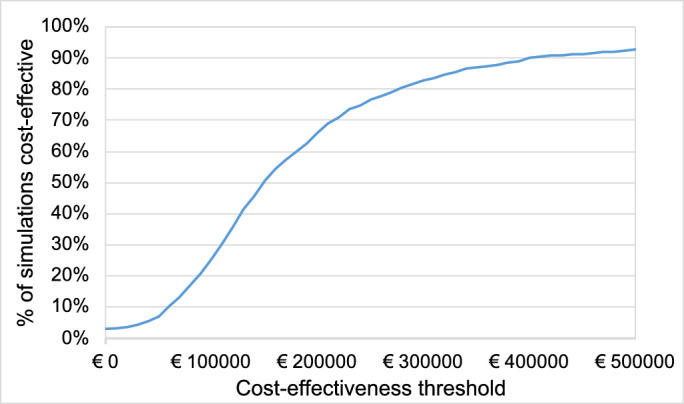
Figure 3.

Cost-effectiveness acceptability curve. Percentage of 1000 simulations in the base case, which would be deemed cost effective under the respective cost-effectiveness threshold. Once the simulations’ ICUR is lower than the threshold, the simulation is considered as cost effective. The blue curve shows which percentage of 1000 simulations would be deemed cost-effective under the threshold on the x-axis.
