
Figure 1. Kaplan-Meier Curves of Patients Who Received Postoperative Adjuvant Concurrent Chemoradiotherapy Stratified Using Elastic Net Penalized Cox Proportional Hazards Regression Models Built With Clinicopathologic and Genetic Features vs Clinicopathologic Features Alone.
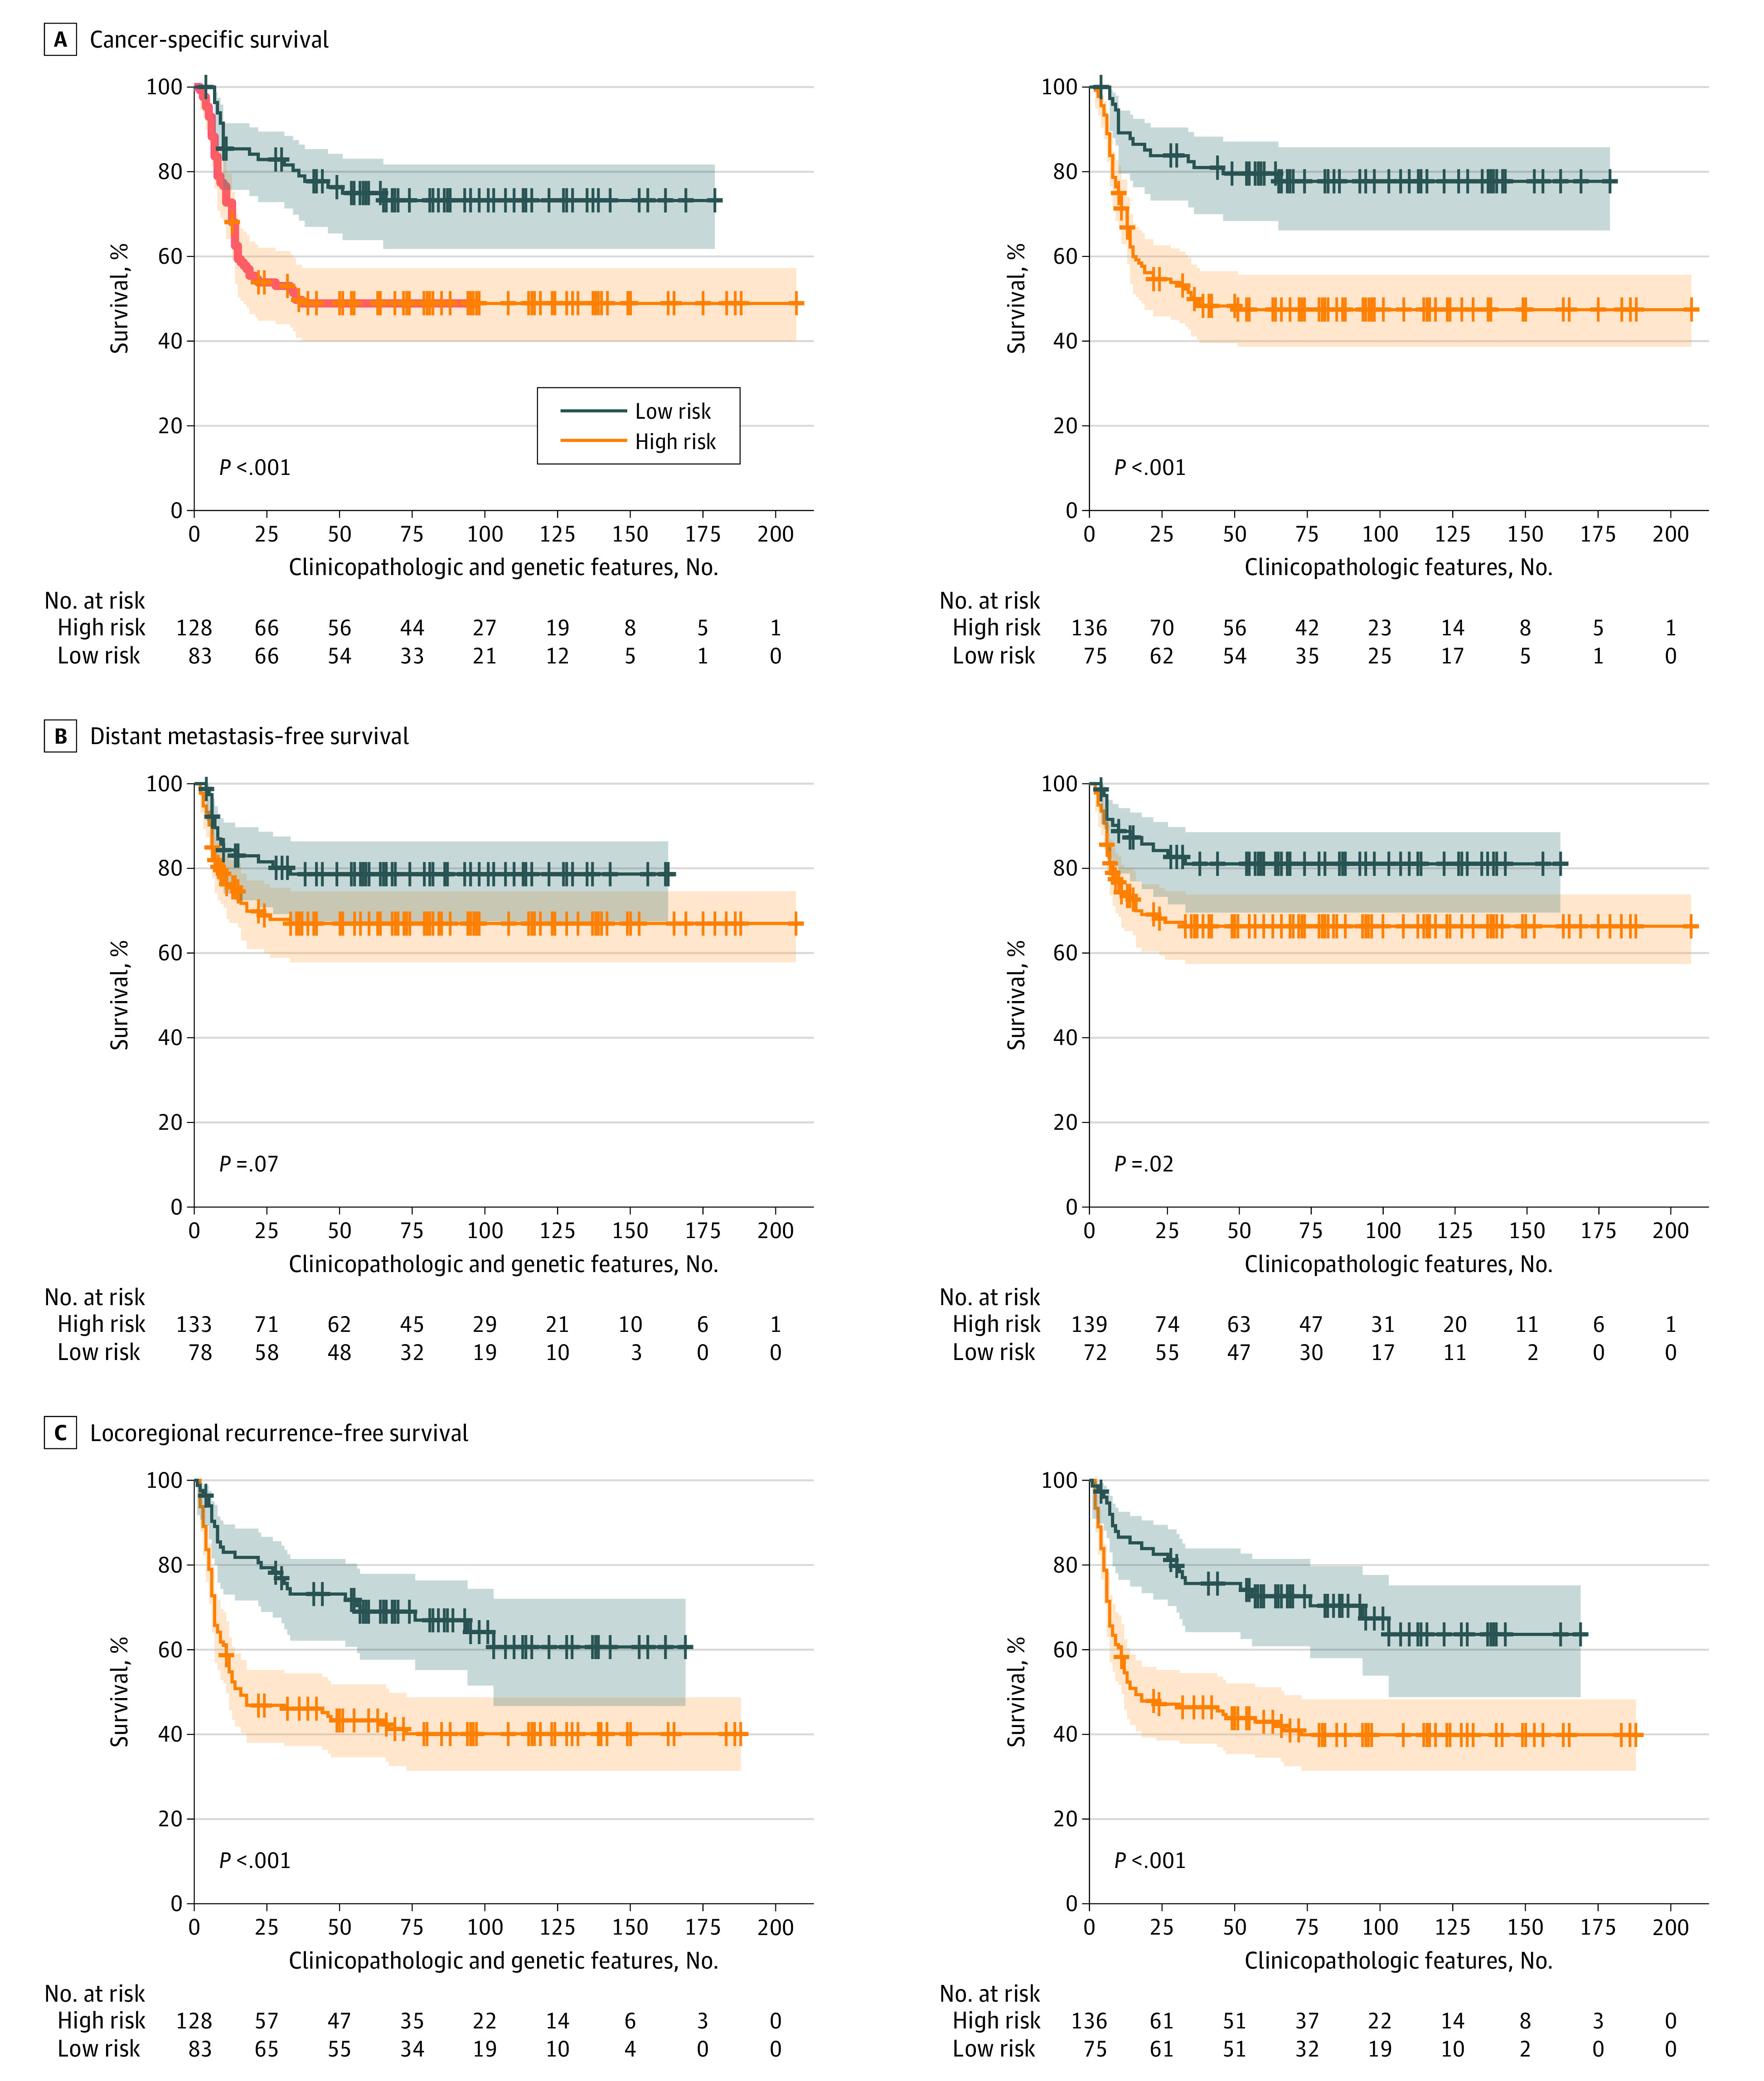
A, Cancer-specific survival. B, Distant metastasis–free survival. C, Locoregional recurrence–free survival. The shaded areas indicate 95% CIs.