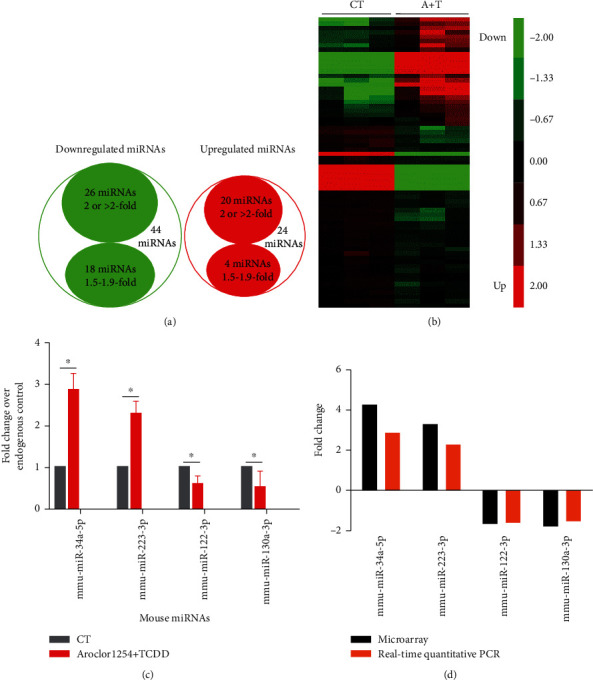
Figure 2.

Differentially expressed miRNAs in the liver of ApoE−/− mice after exposure to TCDD and Aroclor1254 and validation by RT-PCR. (a) Venn diagram showed the downregulated miRNAs (green circle) and upregulated miRNAs (red circle) after TCDD and Aroclor1254 coexposure when compared to vehicle. (b) Heat map showed changes in miRNA expression profile in the liver after coexposure to TCDD and Aroclor1254. The expression pattern (green to red) represents the spectrum of downregulated to upregulated expression pattern of miRNAs. (c) The expression profile of the miRNAs in the liver was determined by real-time PCR. Data are depicted as mean ± SEM from n = 6 mice/group; ∗p < 0.05 as compared between different groups. (d) The comparison between qPCR results and microarray data is depicted.
