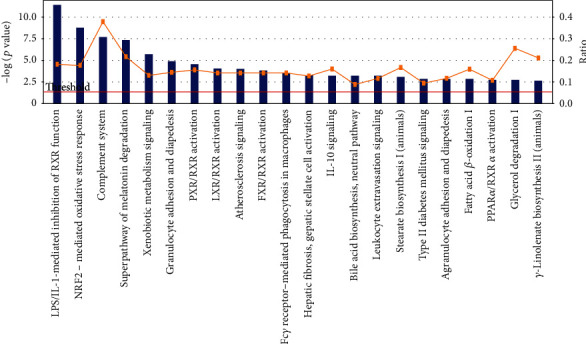
Figure 4.

Significant canonical pathways that responded to TCDD and Aroclor1254 coexposure according to IPA software analysis. Up- and downregulated (1312 genes, fold change > 2, p < 0.05) mRNAs were analyzed using IPA software. The graph showed the various pathways regulated by coexposure to TCDD and Aroclor1254. The p value for each pathway was indicated by the line and is expressed as −1 times the log of the p value. The bar represented the ratio of the number of genes differentially expressed in a given pathway divided by the total number of genes that make up that pathway.
