Figure 4.

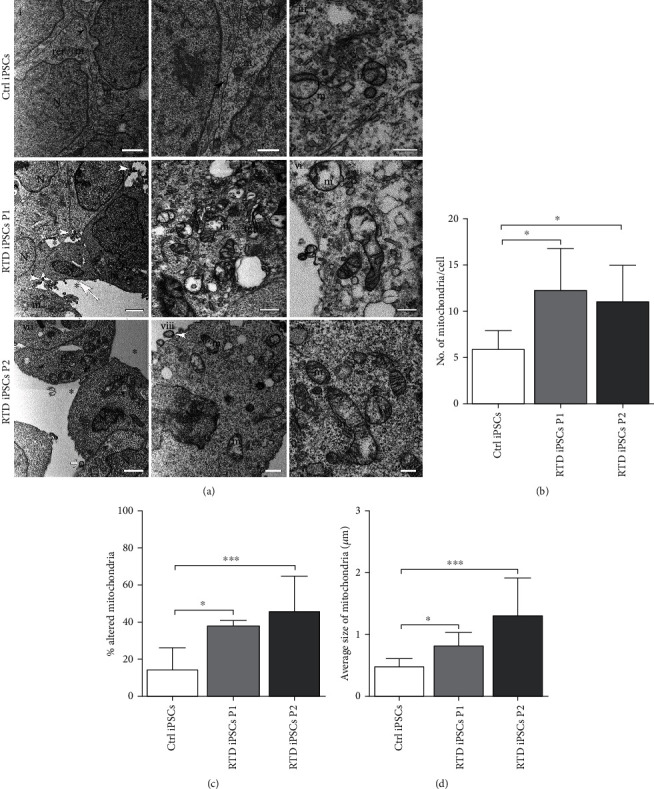
Ultrastructural features of Ctrl and RTD iPSCs. (a) FIB/SEM micrographs showing abnormal cell-cell contacts in RTD iPSC cultures (iv, vii), as compared to Ctrl cells (i, ii) which display recognizable tight junctions (black arrowheads in (i) and (ii)). RTD cell cultures display loose cell-cell contacts and large intercellular spaces (asterisks in (iv) and (vii)). White arrowheads indicate extracellular vesicles, in proximity to plasma membrane protrusions in RTD cells (iv–vii); white arrow in (iv) indicates a membrane-limited cell fragment containing nuclear parts. Ctrl iPSCs show few healthy immature mitochondria with poorly developed cristae (ii, iii) while several damaged organelles with disrupted cristae are observed in RTD iPSCs (P1 and P2) (v, vi, viii, and ix). N: nuclei; m: mitochondria; rer: rough endoplasmic reticulum. Scale bars, 2 μm in (i), (iv), and (vii); 1 μm in (ii), (v), and (viii); 0.5 μm in (iii), (vi), and (ix). (b) Mitochondria are significantly more numerous in patients' iPSCs than in Ctrl. (c) Patients' iPSCs show a significantly higher number of damaged mitochondria, compared to Ctrl. (d) Mitochondrial average size is significantly larger in patients' iPSCs than in Ctrl.
