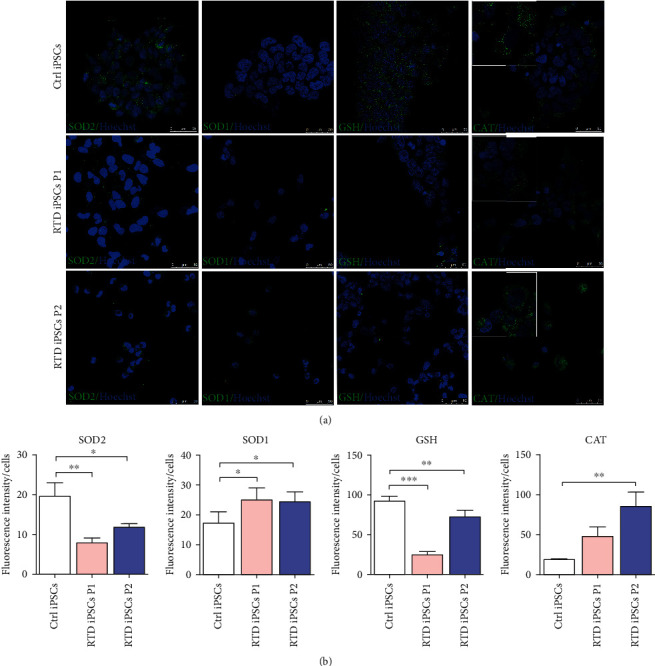
Figure 6.

Confocal analysis of antioxidant molecules in Ctrl and RTD cells. (a) Immunofluorescence images showing finely granular SOD2 localization of higher intensity in Ctrl iPSCs with respect to patients' cells. SOD1 shows cytoplasmic immunostaining irrespective of the conditions with higher intensity in RTD cells. GSH immunolocalization appears abundantly diffused in the cytoplasmic compartment in Ctrl cells, while being sparser and occasionally aggregated in diseased iPSCs. CAT immunofluorescence is mostly granular in Ctrl iPSCs while more diffuse cytosolic staining is observed in RTD cells, especially P2 (insets). Antioxidant enzymes are marked by green fluorescence while nuclei are stained with Hoechst (in blue). (b) Fluorescence intensity analyses show statistically different expression levels of antioxidant markers. ∗p ≤ 0.05vs. Ctrl iPSCs; ∗∗p ≤ 0.01; ∗∗∗p ≤ 0.001vs. Ctrl iPSCs.
