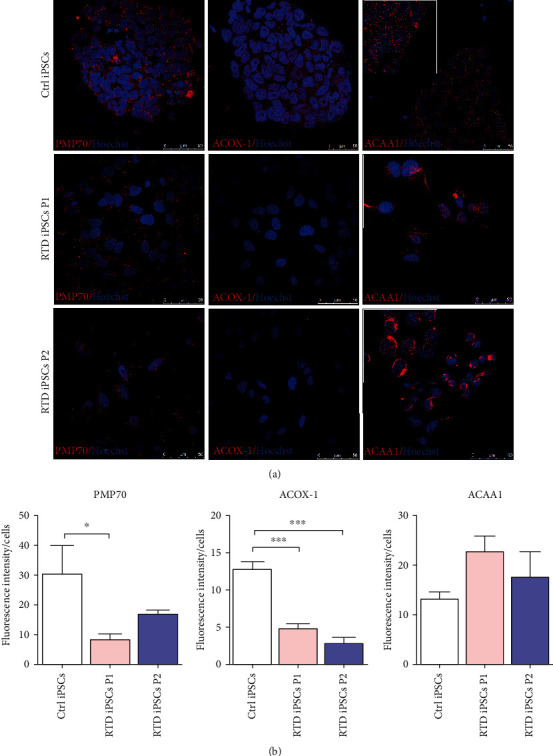
Figure 7.

Confocal analysis of peroxisomal markers in Ctrl and RTD cells. (a) Immunofluorescence images showing finely granular immunoreactivity to PMP70 and ACOX-1, of lower intensity in RTD patients, as compared to Ctrl cells. ACAA1 distribution appears more diffuse in RTD cells (insets). Peroxisomal proteins are marked by green fluorescence, while nuclei are stained with Hoechst (in blue). (b) Fluorescence intensity analyses show statistically different expression levels of peroxisomal markers. ∗p ≤ 0.05vs. Ctrl iPSCs; ∗∗p ≤ 0.01vs. Ctrl iPSCs.
