Figure 8.

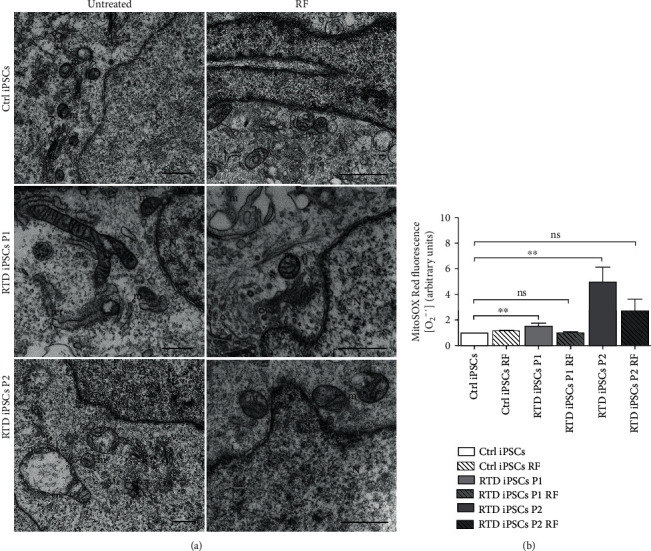
Morphofunctional effects of RF treatment on Ctrl and RTD iPSCs. (a) FIB/SEM analysis showing altered morphology in RTD vs. Ctrl iPSCs and rescue of mitochondrial ultrastructural features following RF supplementation. N: nuclei; m: mitochondria; g: Golgi complex; rer: rough endoplasmic reticulum. Scale bars, 1 μm. (b) MitoSOX analysis in Ctrl and RTD cells, showing a significantly (∗∗p ≤ 0.01) higher concentration of O2-. in patients' cells as compared to Ctrl. Redox status in RTD cells from either patient returns to Ctrl levels following RF treatment (ns: nonsignificant differences between Ctrl and RTD P1/P2+RF).
