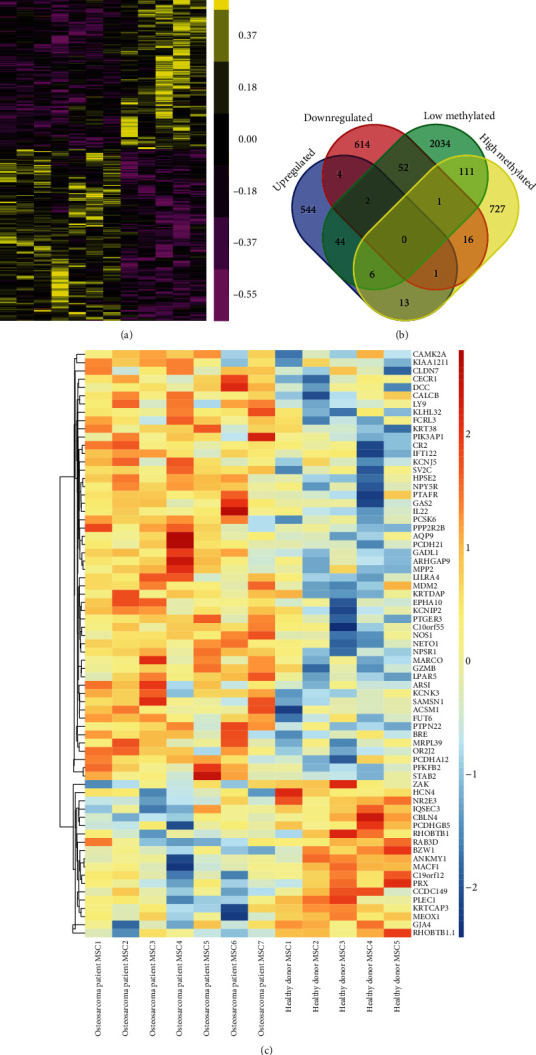
Figure 3.

GSE42572 was analyzed to identify differently expressed genes in OS compared to normal samples. (a) 614 induced genes and 696 reduced genes in OS compared to healthy control samples. (b) Among DEGs, a total of 18 downregulated hypomethylation genes and 52 upregulated hypomethylation genes were screened out. (c) The 70 differentially expressed OS-specific methylated genes were presented by heat map.
