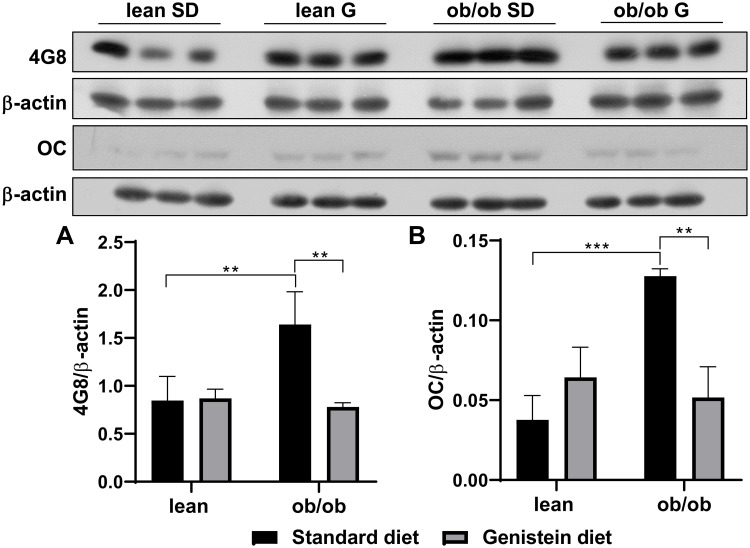
Figure 4.
Effect of genistein on Aβ deposition in the brain of ob/ob mice. (A) Representative blot images with the corresponding densitometry measurement of 4G8. (B) Representative blot images with the corresponding densitometry measurement of OC. Data are presented as mean ± SEM for 3 mice per group. **p ≤ 0.01, ***p ≤ 0.001.
Abbreviations: SD, standard diet; G, genistein.

