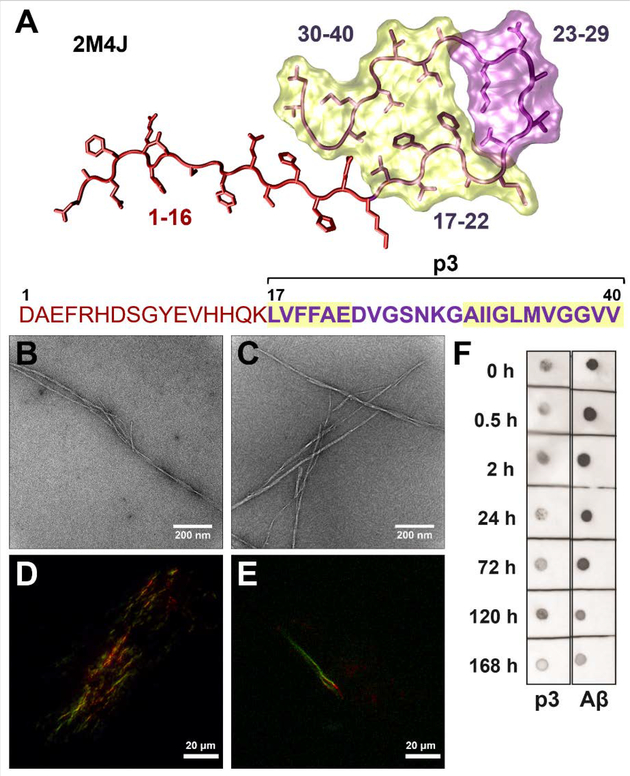
Figure 1. Fibrillogenicity of p3 compared with Aβ.
A) Fibril structure35 and sequence of Aβ(1–40), with p3(17–40) indicated in purple. Highlighted regions (17–22 and 30–40) indicate the amyloidogenic regions of Aβ, calculated by AGGRESCAN.13 TEM images of fibrillar B) p3 and C) Aβ. Polarized light microscopy images of CR stained D) p3 and E) Aβ fibrils. F) Dot blots stained for OC binding for Aβ and p3. All peptide samples were prepared at 20 μM and incubated for 7 days at 37 °C in PBS (pH 7.4).

