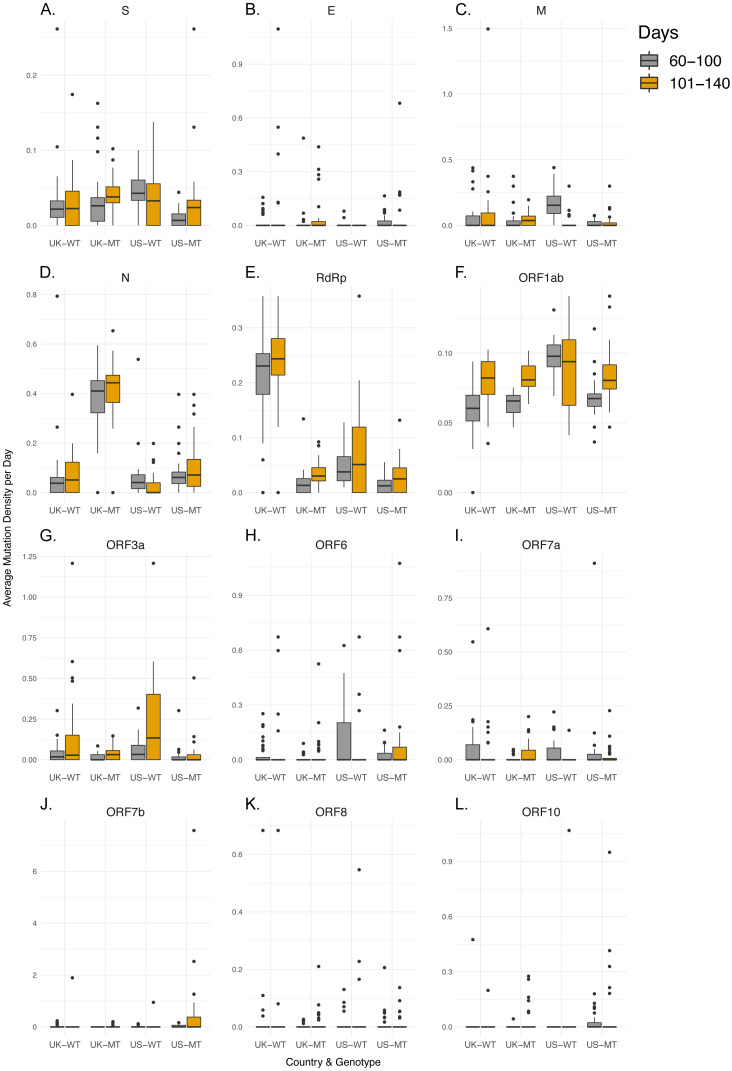
Figure 2. Synonymous mutation density rates do not shift significantly between early and late periods when comparing WT and MT samples.
(A-L) Synonymous mutation density of regions of interest UK-WT, UK-MT, US-WT, and US-MT samples divided into early period (60–100 days) and late period (101–140 days), with gray bars indicating early period samples, and orange bars indicating late period samples for (A) S, (B) E, (C) M, (D) N, (E) RdRp, (F) Orf1ab, (G) Orf3a, (H) Orf6, (I) Orf7a, (J) Orf7b, (K) Orf8, and (L) Orf10 regions. The average mutation density per day is calculated in average nucleotides mutated per gene/locus across all isolates. Mutations in the RdRp coding region are included in both the RdRp plot and the Orf1ab plot.

