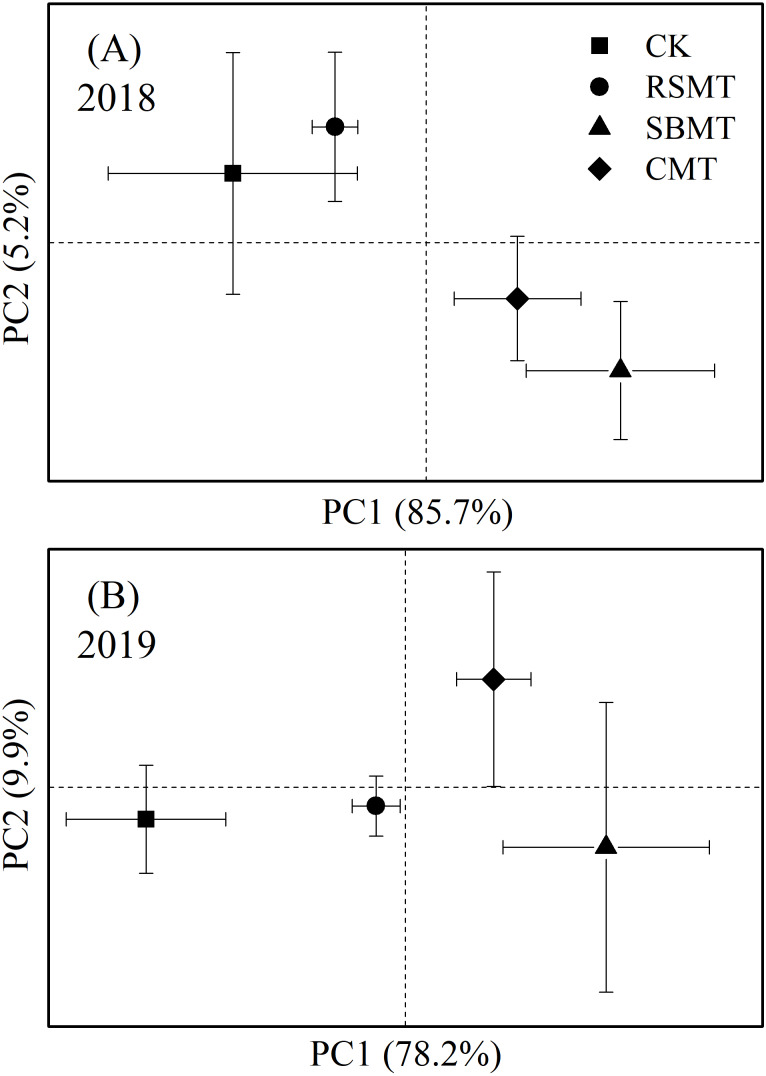
Figure 3. PCA for PLFAs in topsoil samples under different fertilizer treatments in 2018 (A) and 2019 (B).
In 2018, PC1 and PC2 accounted for 85.7% and 5.2% of the total variance, respectively; In 2019, PC1 and PC2 accounted for 78.2% and 9.9% of the total variance, respectively. CK, RSMT, SBMT and CMT represent no organic fertilizer treatment, rapeseed meal treatment, soybean meal treatment and cattle manure treatment, respectively. Data were means ± standard error (n = 3).

