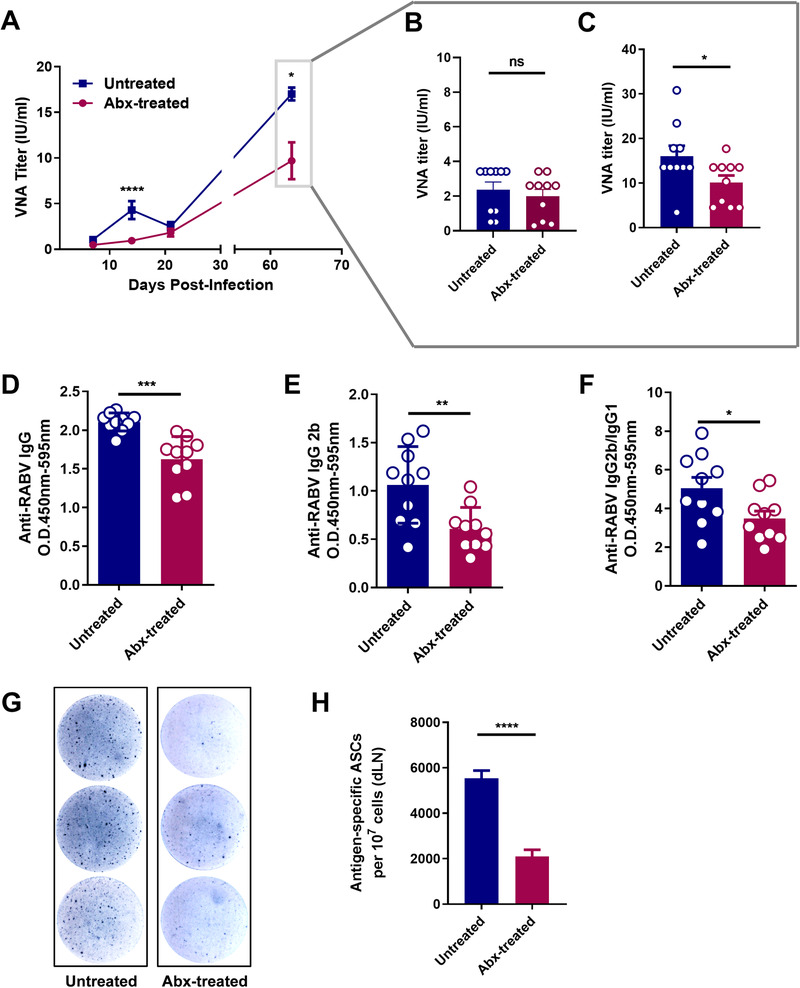
FIGURE 3.

Impact of gut microbiome on the secondary immune responses. A‐C, RABV inoculated mice were boosted with 107 FFU iLBNSE 56 days after the primary inoculation (Untreated mice, n = 10, Abx‐treated mice, n = 10). A, Serum VNA titers were measured by FAVN test. Error bars in the graphs represent standard error (* P < .05; **** P < .0001; Student's t‐test). B, Serum VNA titers before the boost and (C) 14 days after the boost. Error bars in the graphs represent standard error (* P < .05; Student's t‐test). D‐F, Anti‐RABV IgG, IgG2b, and the IgG2b/IgG1 ratio were measured by indirect ELISA, and antibody levels in untreated mice were significantly higher than in Abx‐treated mice. Error bars in the graphs represent standard error (* P < .05; ** P < .01; *** P < .001; Student's t‐test). G, Representative ELISpot images of ASCs from the dLNs of Abx‐treated and untreated mice (Untreated mice, n = 5, Abx‐treated mice, n = 5). H, ASCs in the dLNs were quantified. Error bars represent standard error (**** P < .0001; Student's t test)
