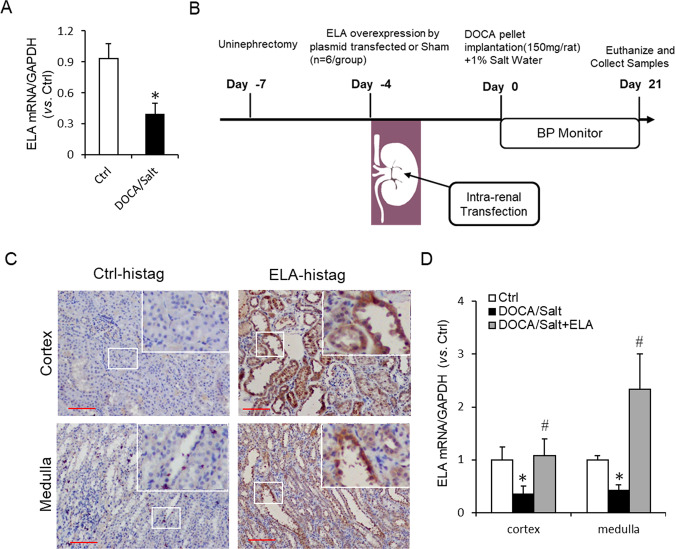
Fig. 1. Expression and rescue experiment of ELA in DOCA/salt-induced hypertensive rats.
a The mRNA level of ELA in the renal medulla of DOCA/salt-treated rats (n = 6 per group). b Diagram of the animal protocol for ELA treatment in this study. c Representative immunohistochemical staining of ELA-histag in renal cortex and medulla. Kidneys without ELA-his tag transfection were used for Negative control. Scale bar, 100 µm. d The mRNA level of ELA in the kidneys of control group, DOCA/salt-treated group and DOCA/salt + ELA treated group (n = 6 per group). *P < 0.05 versus Control group; #P < 0.05 versus DOCA/salt group.

