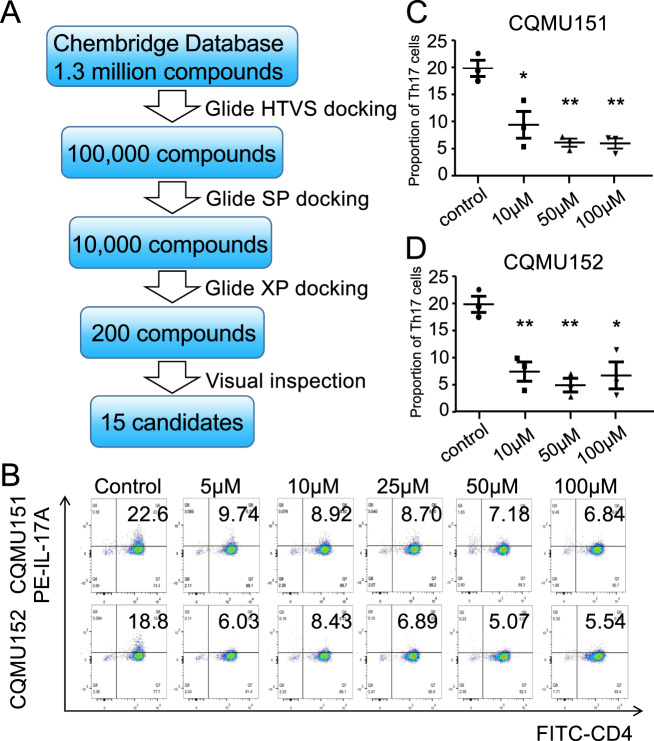
Fig. 1. Virtual screening process and in vitro screening.
a Flowchart of structure-based virtual screening for RORγt inverse agonist discovery. b Representative graphs of multiple screening results of CQMU151 and CQMU152 at a concentration of 5, 10, 25, 50, and 100 μM. c, d Statistics of three repeated experiments of CQMU151 and CQMU152 at concentrations of 10, 50, and 100 μM (*P < 0.05, **P < 0.01 versus the control group with Student’s t-test, n = 3).

