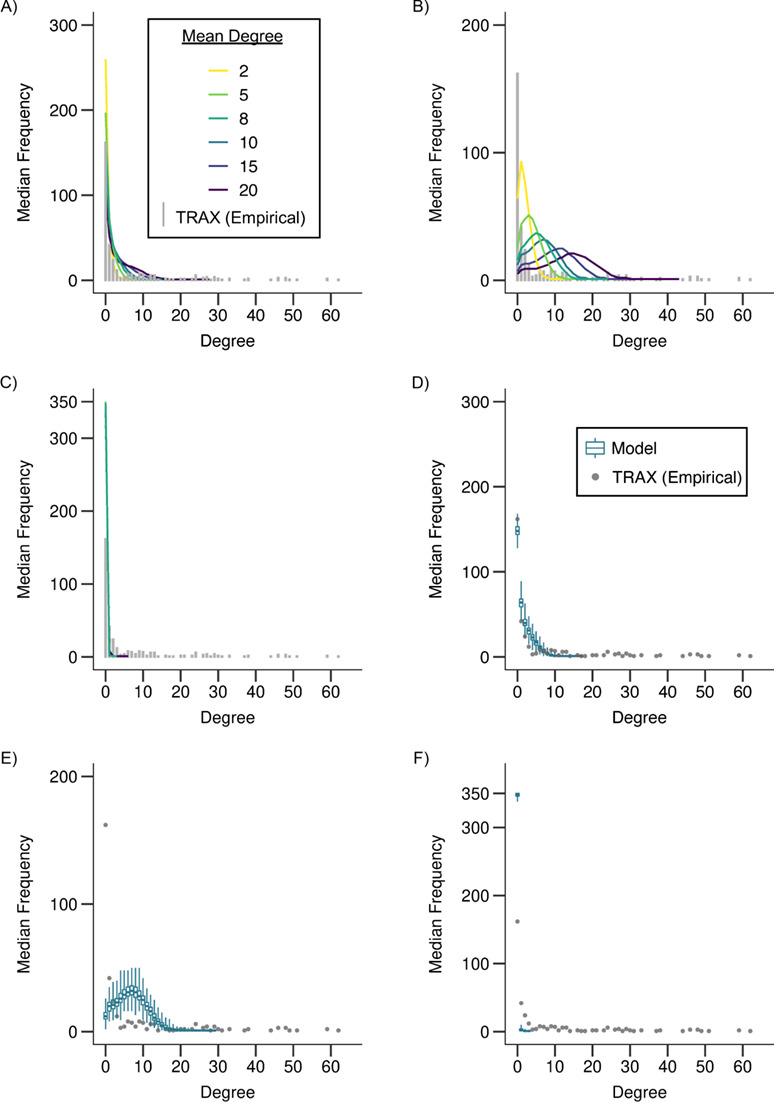
Figure 2.

Degree distributions of empirical (≤5 single nucleotide polymorphisms (SNPs)) and modeled, sampled networks under scenario 1 (random sampling (panels A and D)) and scenario 2 (oversampling of high (panels B and E) and low (panels C and F) transmitters) as compared with an empirical network of extensively drug-resistant (XDR) tuberculosis (TB) cases, KwaZulu-Natal, South Africa, 2011–2014. In panels A–C, the gray bars show the distribution of the number of links per case, or the degree distribution, of the empirical network (≤5 SNPs) from the Transmission Study of XDR TB (TRAX Study). Each colored line shows the median degree distribution across 1,000 modeled, sampled networks for the corresponding model. Line color indicates the mean degree, or the average number of transmissions per case, assumed in the complete, modeled network. Panels D–F show the range of the degree distributions of the modeled, sampled networks for 1 model (mean degree = 10). The gray dots show the degree distribution of the empirical network (≤5 SNPs) from the TRAX Study and are equivalent to the distribution shown by the gray bars in panel A. Colored box plots show the median, interquartile range, minimum, and maximum frequencies for each degree in the distribution across 1,000 modeled, sampled networks. See Web Figure 3 for more detail on panel C.
