
Figure 2.
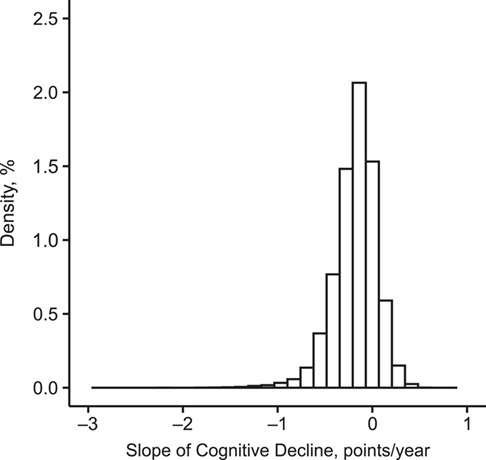
Distribution of individual slopes of cognitive decline, as measured by the Telephone Interview for Cognitive Status (25), in the Nurses’ Health Study (n = 14,956), United States, 1995–2008. Cases (n = 1,496) were defined as the women with the 10% worst cognitive slopes (cutoff value ≤ −0.461) and controls (n = 7,478) as those with a cognitive slope above the median (cutoff value > −0.156).