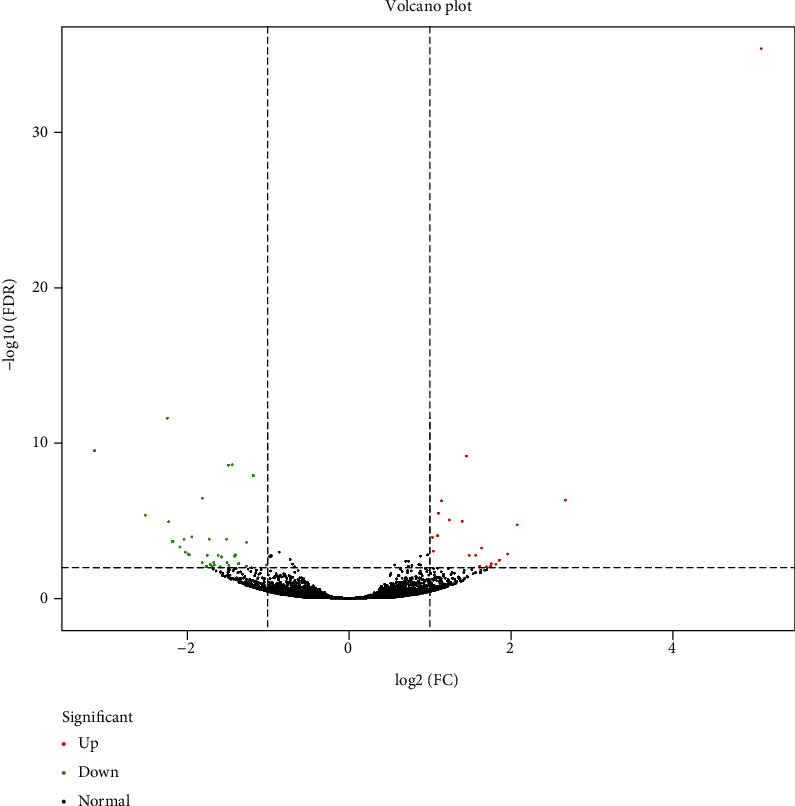
Figure 2.

Volcano plot of differentially expressed genes. Notes: each point in the differential expression volcano plot represents a gene. The abscissa represents the absolute value of the fold change in gene expression in the two samples, and the ordinate represents the statistically significant negative logarithm value of the gene expression change. In the plot, green dots represent downregulated differentially expressed genes, red dots represent upregulated differentially expressed genes, and black dots represent nondifferentially expressed genes.
