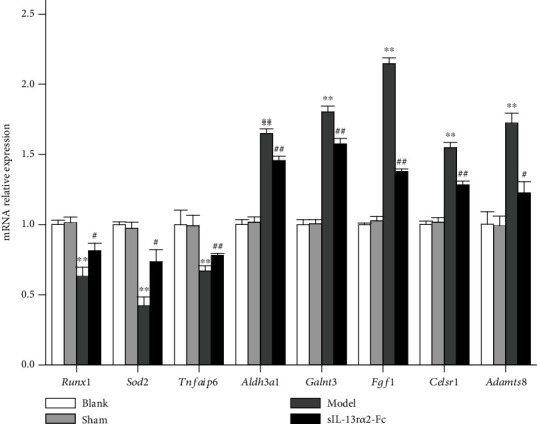
Figure 5.

Real-time fluorescence quantitative PCR verification of genes. vs. the sham group, ∗∗P < 0.01; vs. the model group, #P < 0.05, ##P < 0.01.

Real-time fluorescence quantitative PCR verification of genes. vs. the sham group, ∗∗P < 0.01; vs. the model group, #P < 0.05, ##P < 0.01.