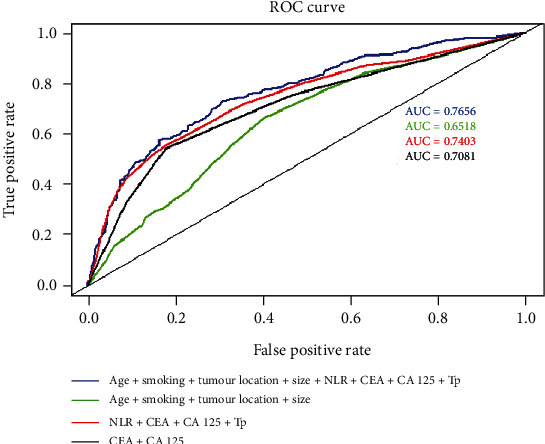
Figure 2.

ROC curves of the combination of features for predicting obstruction status. The green line includes age, smoking status, tumour location, and tumour size; the dark line includes CEA and CA 125; the red line includes NLR, CEA, CA 125, and Tp, with AUCs of 0.6518, 0.7081, and 0.7403, respectively. When these factors were used together (age, smoking, tumour location, tumour size, NLR, CEA, CA 125, and Tp), the AUC was 0.7656.
