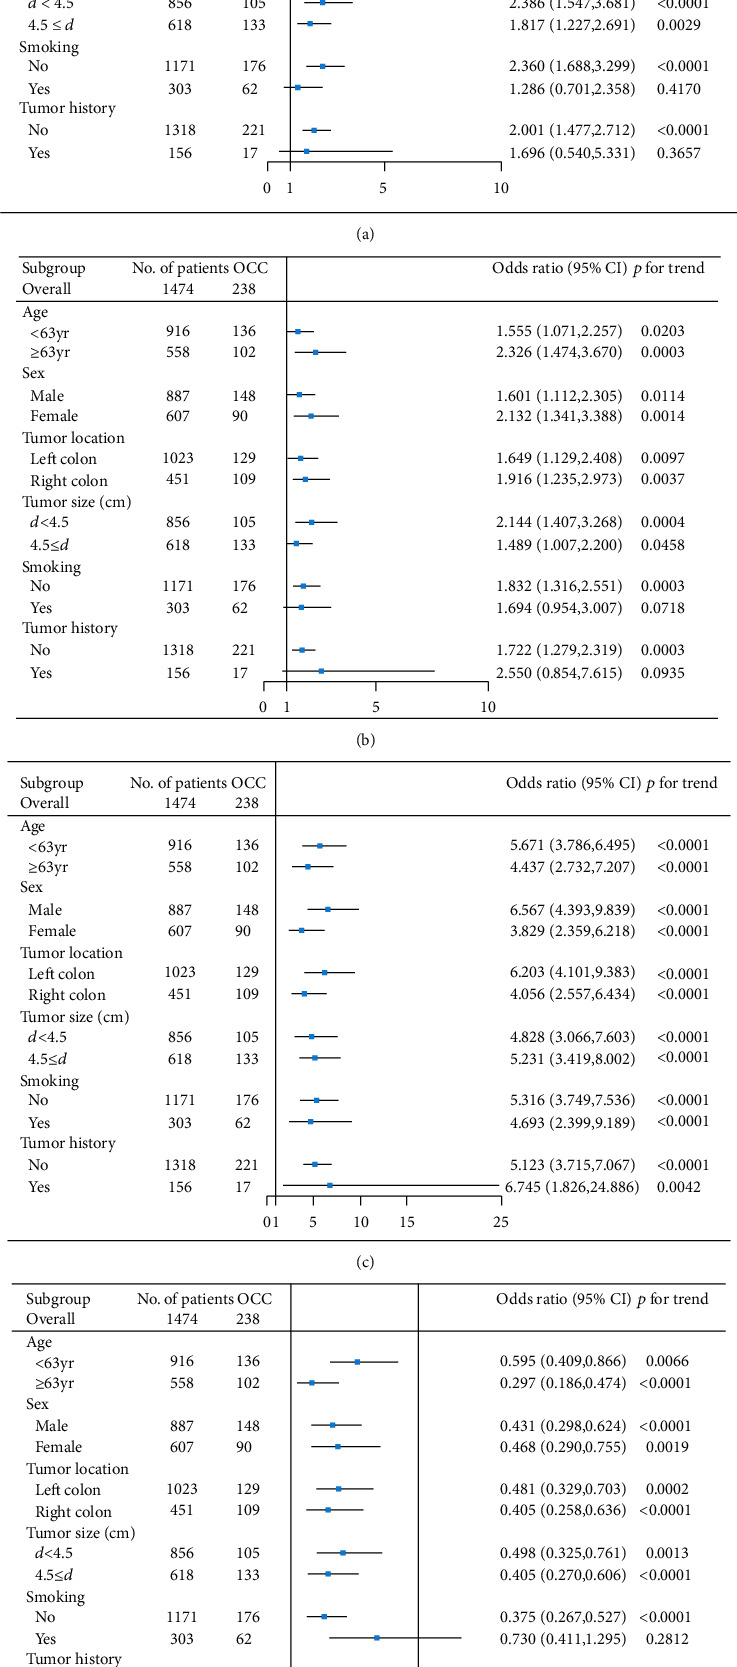
Figure 3.

The forest plot of the impact of different factors on the colorectal cancer patients in different subgroups. (a) A forest plot of the impact of NLR on the colorectal cancer patients in different subgroups. (b) A forest plot of the impact of CEA on the colorectal cancer patients in different subgroups. (c) A forest plot of the impact of CA 125 on the colorectal cancer patients in different subgroups. (d) A forest plot of the impact of Tp on the colorectal cancer patients in different subgroups.
