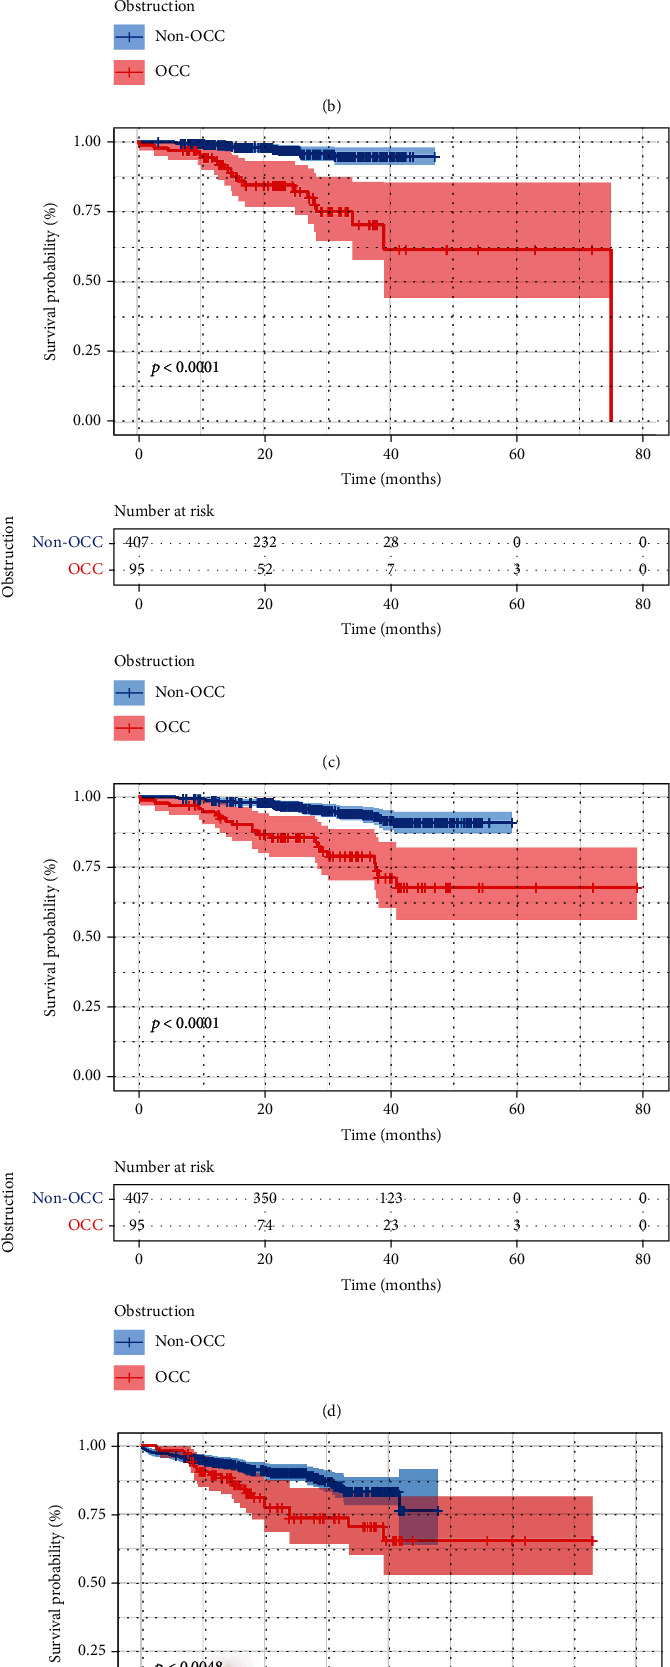
Figure 4.

Comparison of DFS and OS between the OCC and non-OCC groups. (a) Comparison of DFS between the OCC and non-OCC groups. (b) Comparison of OS between the OCC and non-OCC groups. (c) Comparison of DFS between the OCC and non-OCC groups in stage II. (d) Comparison of OS between the OCC and non-OCC groups in stage II. (e) Comparison of DFS between the OCC and non-OCC groups in stage III. (f) Comparison of OS between the OCC and non-OCC groups in stage III.
