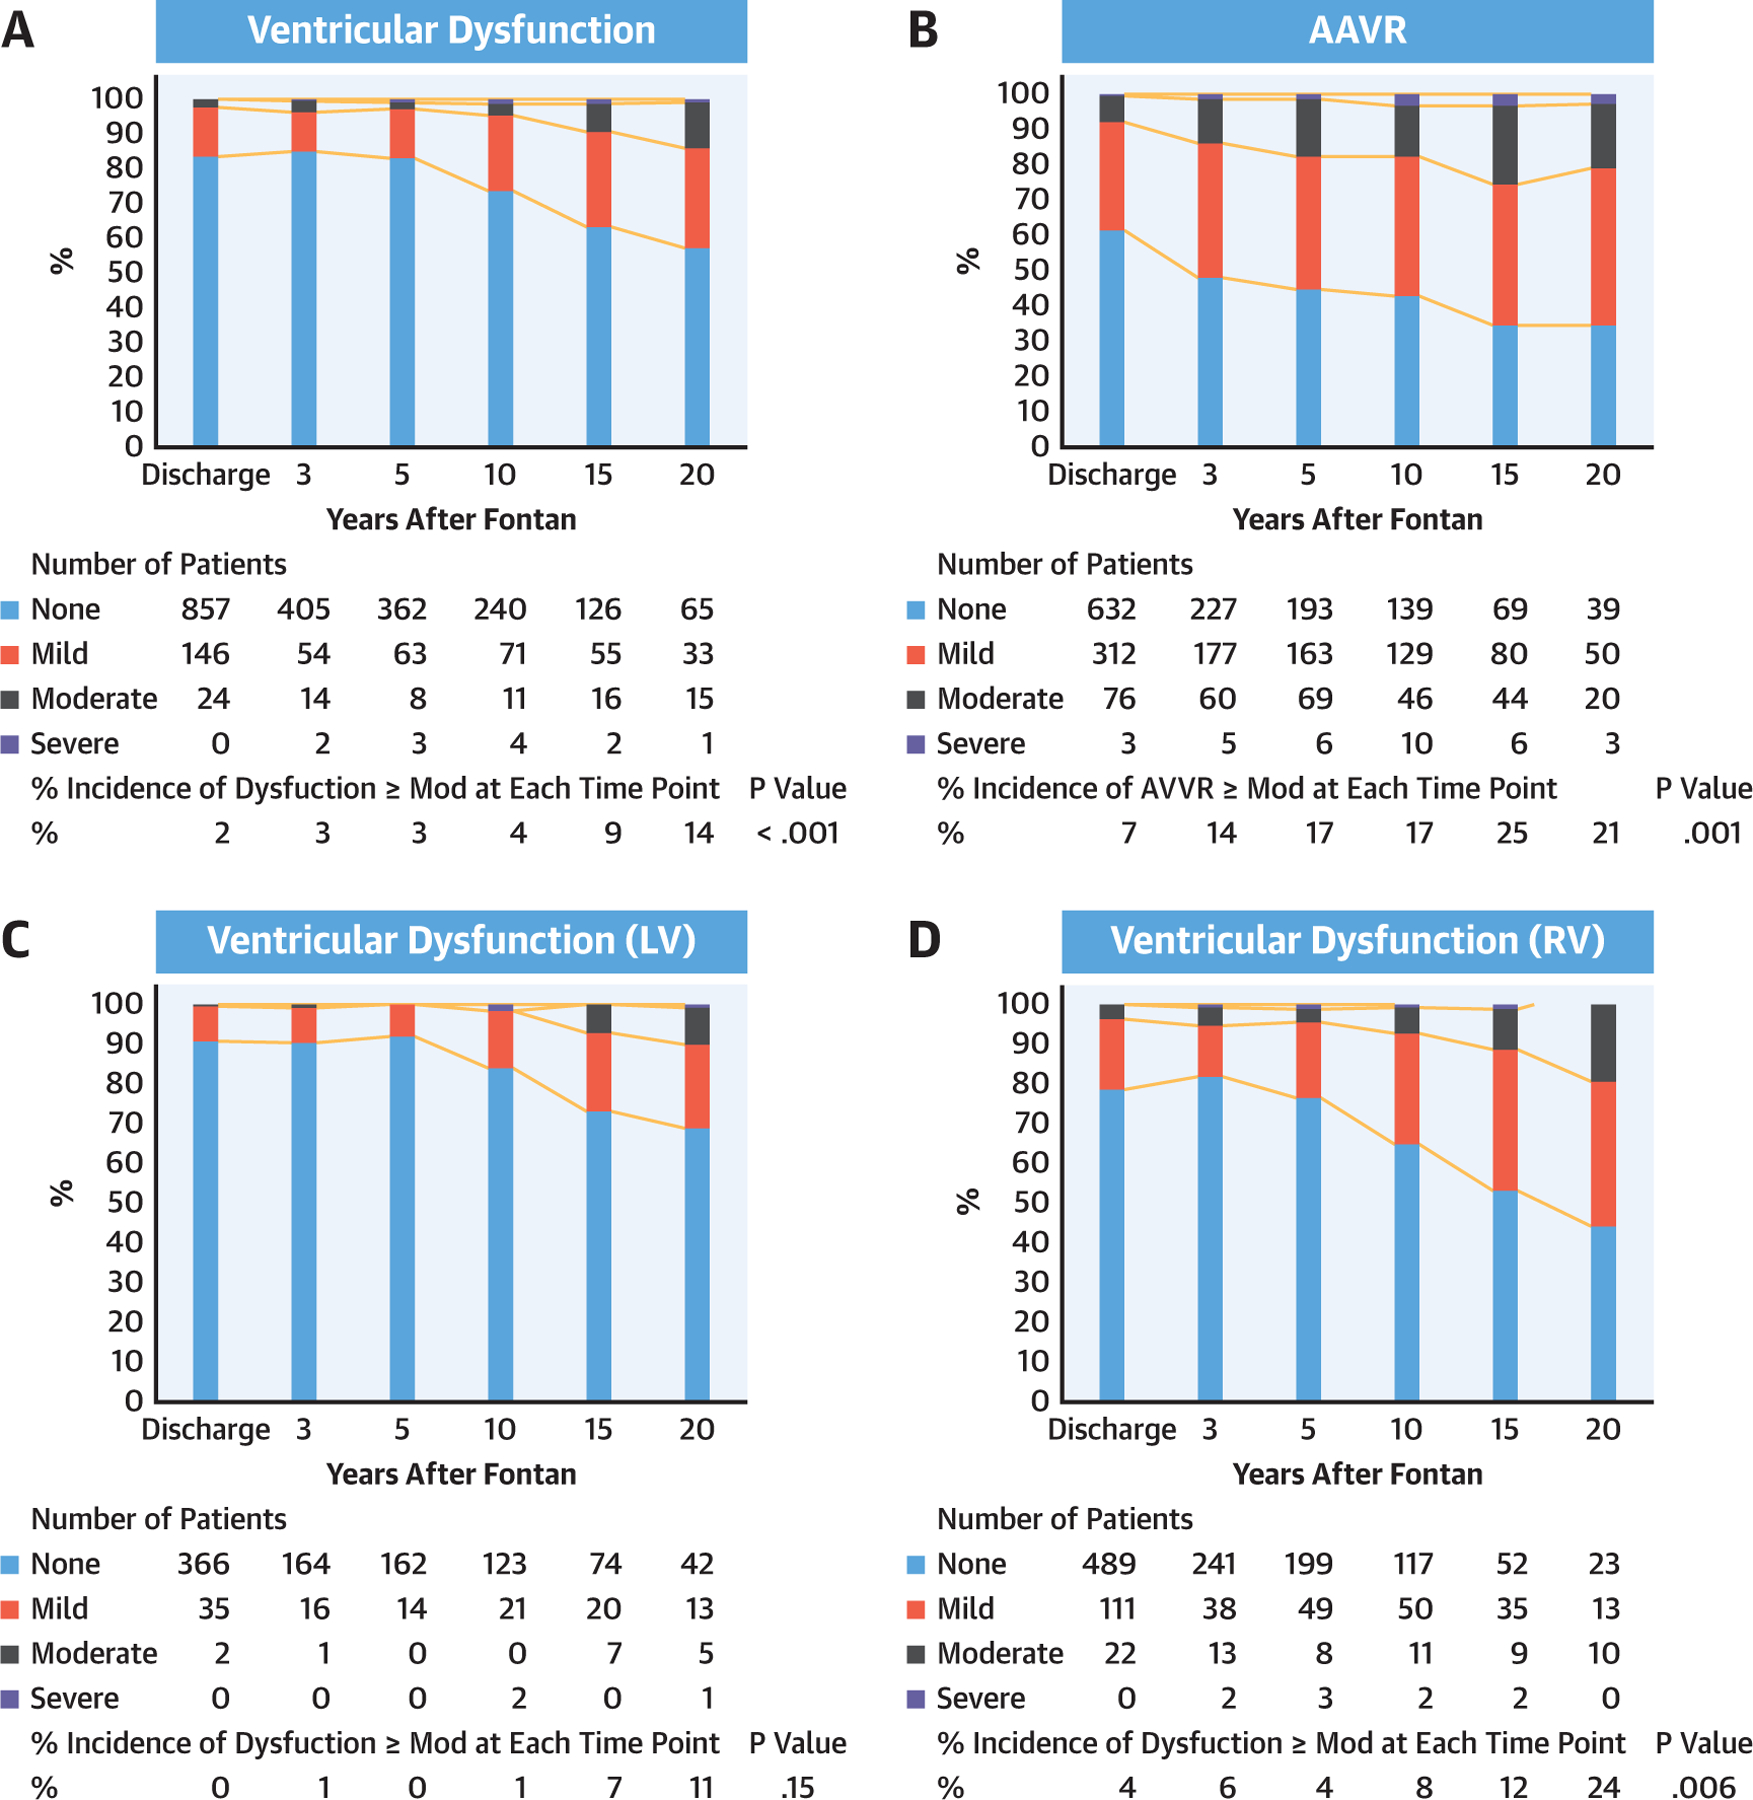
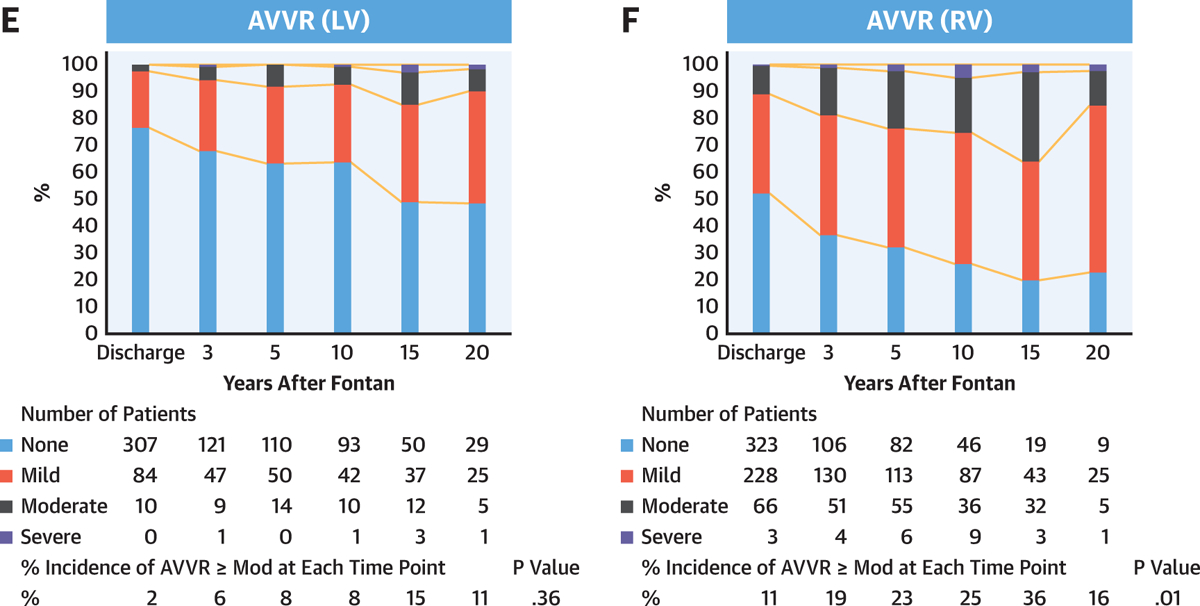
FIGURE 3. Progression of Ventricular Dysfunction and AVVR After Fontan.


Progression of ventricular dysfunction (A) and AVVR (B) after Fontan by serial echocardiogram. Ventricular dysfunction (C and D) and AVVR (E and F) are worse in patients with a single RV (C–F). Percent incidence of ventricular dysfunction ≥ moderate and AVVR ≥ moderate at each time point was compared using Cochran’s Q test. AVVR = atrioventricular valve regurgitation; LV = left ventricle; Mod = moderate; RV = right ventricle.
