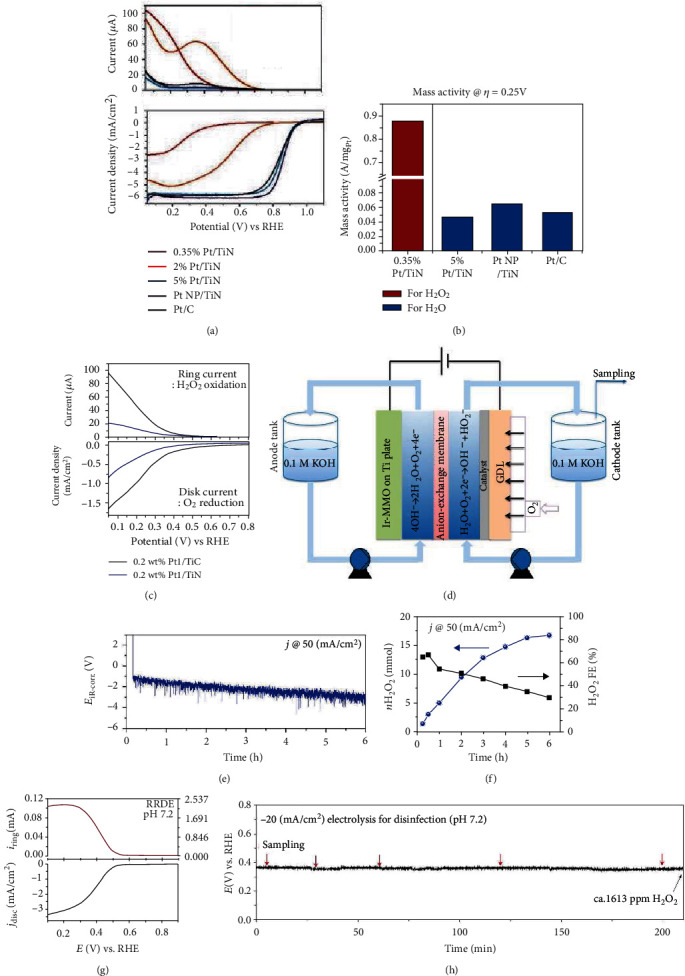
Figure 15.

Production of hydrogen peroxide with SAECs. (a) LSV curves and ring currents in acid electrolyte. Reproduced from [136]. (b) Comparison of mass activity for different Pt catalysts. Reproduced from [136]. (c) Comparison of ring currents on different Pt catalysts. Reproduced from [113]. (d) Schematic illustration of the microflow cell. Reproduced from [137]. (e) Durability test of the microflow cell setup. Reproduced from [137]. (f) Productivity and Faradic efficiency for H2O2. Reproduced from [137]. (g) ORR polarization curves of Fe-CNT in neutral electrolyte. Reproduced from [183]. (h) Durability test of Fe-CNT catalyst. Reproduced from [183].
