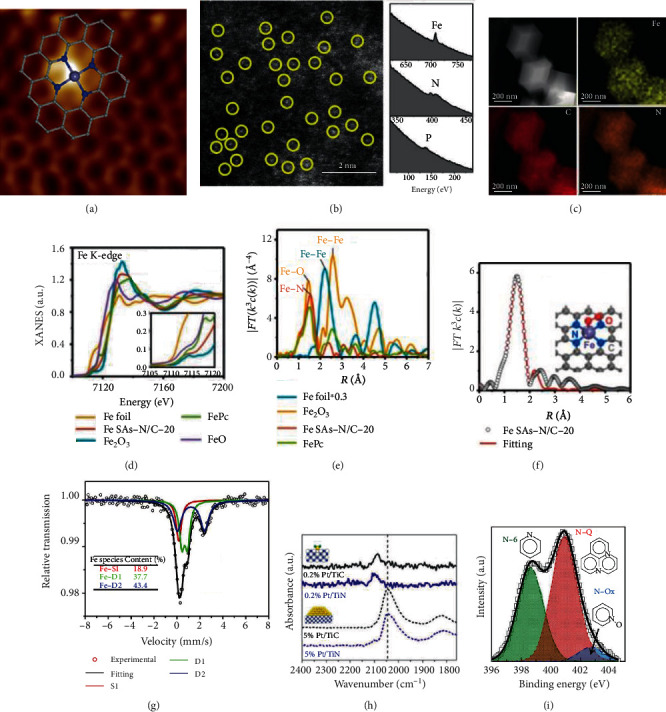
Figure 6.

Characterization techniques for SAECs. (a) STM image of single-atom FeN4/GN-2.7 (2 nm × 2 nm). Reproduced from [112]. (b) AC-STEM image of Fe-N/P-C-700 and corresponding EELS atomic spectra of Fe, N, and P elements from the bright dots shown in the yellow circle. Reproduced from [77]. (c) HAADF-STEM image and element mapping of single-atom Fe catalyst. Reproduced from [51]. (d) XANES spectra of Fe K-edge. Reproduced from [53]. (e) FT k3-weighted EXAFS spectra. Reproduced from [53]. (f) Fitting curves of FT-EXAFS. Reproduced from [53]. (g) Mössbauer spectrum of 57Fe. Reproduced from [77]. (h) Diffuse reflectance FT-IR spectra of adsorbed CO. Reproduced from [113]. (i) XPS spectra of N 1 s. Reproduced from [114].
