
Figure 8.
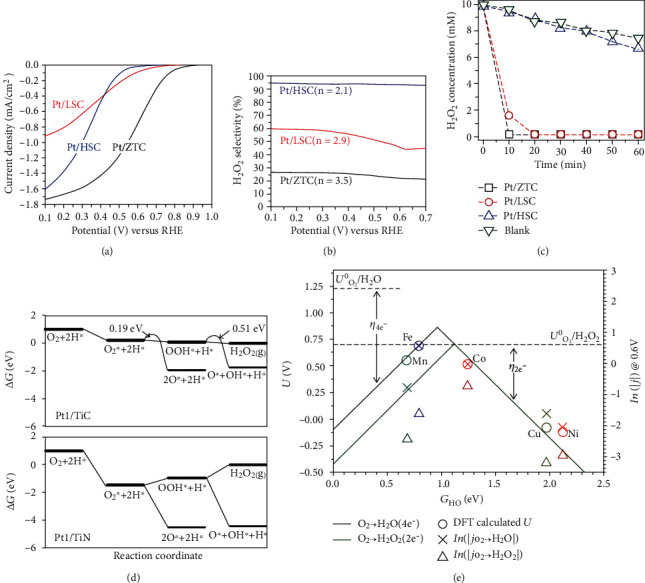
Oxygen reduction reaction via 2e− pathway on SAECs. (a) ORR polarization curves of prepared catalysts. Reproduced from [34]. (b) Selectivity towards H2O2 measured with RRDE. Reproduced from [34]. (c) Changes of H2O2 concentration. Reproduced from [34]. (d) Comparison of 2e− ORR-free energy diagrams on Pt/TiN(100) and Pt/TiC(100). Reproduced from [113]. (e) Volcano curves for 2e− (green solid line) and 4e− (black solid line) ORR. Reproduced from [137].