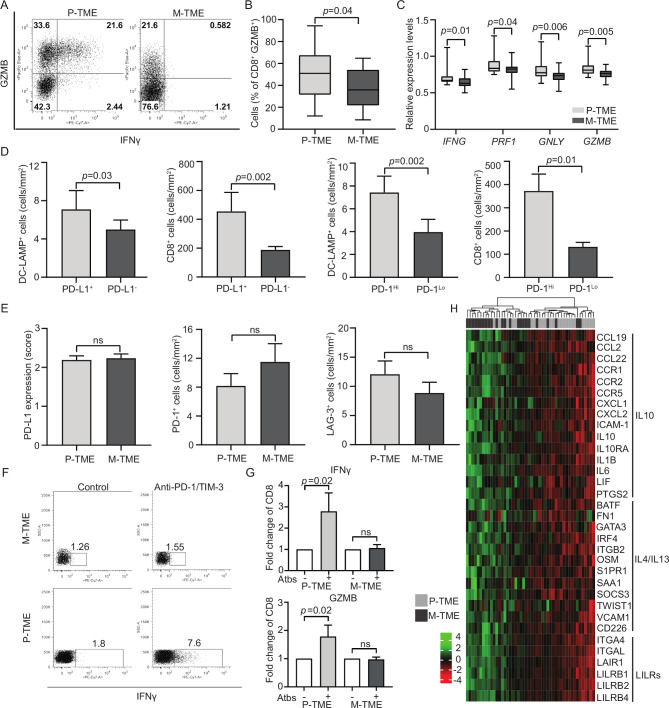
Figure 3.
Functional T-cell exhaustion in the metastatic tumor microenvironment (M-TME) of patients with high-grade serous carcinoma (HGSC). (A and B) Percentage of interferon gamma (IFN-γ+) and granzyme B (GZMB)+ cells in the CD3+CD8+ population of the paired 15 primary (P-TME) and 15 metastatic tumor microenvironment (M-TME) microenvironment of patients from study group 2 on non-specific stimulation with phorbol 12-myristate13-acetate (PMA) and ionomycin, as determined by flow cytometry. Gating strategy (A) and quantitative results (B) are reported. Box plots: lower quartile, median, upper quartile; whiskers, minimum, maximum. (C) Expression levels of IFNG, perforin 1 (PRF1), granulysin (GNLY) and GZMB relative to CD3E in 24 P-TME versus 24 M-TME samples from study group 1, as determined by RNA sequencing. P values are reported. (D) Density of CD8+ T cells and lysosomal-associated membrane protein (DC-LAMP+) dendritic cells (DCs) in the M-TME of programmed death ligand 1 (PD-L1)− versus PD-L1+ and programmed cell death 1 (PD-1)Lo versus PD-1Hi patients from study group 1 (n=80), as determined by immunostaining. Box plots: lower quartile, median, upper quartile; whiskers, minimum, maximum. (E) Distribution of PD-L1 levels and density of PD-1+ and lymphocyte-activating gene 3 (LAG-3)+ cells in paired 80 P-TME and 80 M-TME samples from study group 1, as determined by immunostaining. Box plots: lower quartile, median, upper quartile; whiskers, minimum, maximum. (F) Gating strategy of IFN-γ+ CD3+CD8+ T cells in paired 15 P-TME and 15 M-TME samples (study group 2). The percentage of cells in each gate is reported. (G) Fold change of IFN-γ+ and GZMB+ CD8+ T cells isolated from paired 15 P-TME and 15 M-TME samples (study group 2) after non-specific stimulation with PMA and ionomycin in the context of PD-1 and TIM-3 blockage (Atbs) as determined by flow cytometry. P values are indicated. (H) Hierarchical clustering of 33 genes linked to cytokine/chemokine signaling that were differentially expressed in paired 24 M-TME versus 24 P-TME samples from study group 1. P values are reported. IL, interleukin; ns, not significant.

