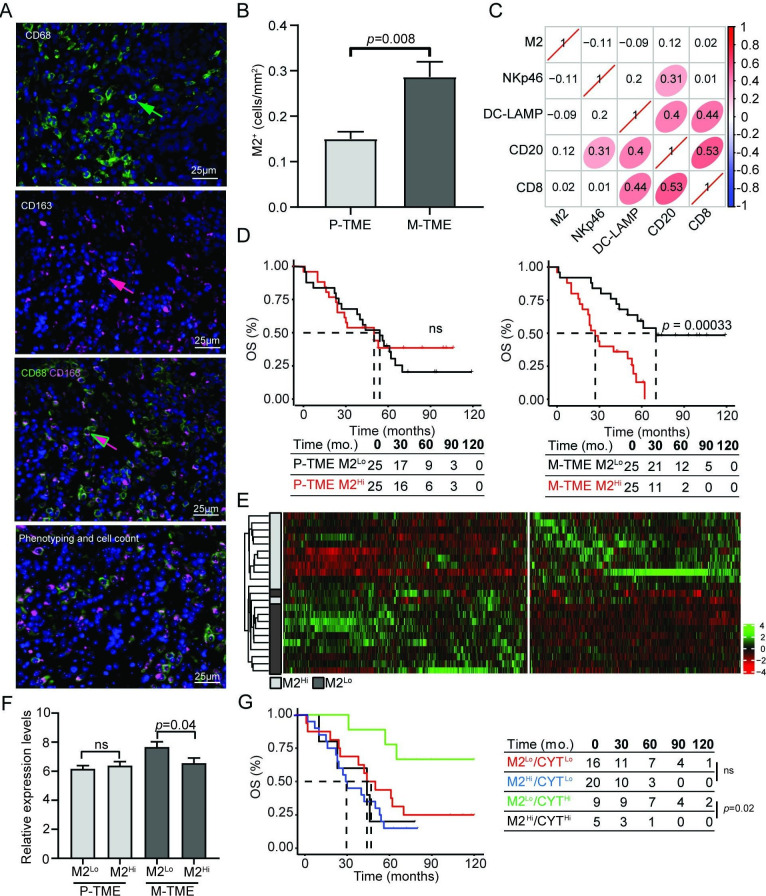
Figure 4.
M2-like tumor-associated macrophages (TAMs) dictate clinically relevant immunosuppression in the metastatic tumor microenvironment (M-TME) of high-grade serous carcinoma (HGSC). (A) Representative images of CD68 and CD163 immunofluorescence. Cells expressing CD68 (green arrow), cell expressing CD163 (red arrow), and cells coexpressing CD68 and CD163 (red/green arrow). For automated counting, Calopix software allows cell segmentation based on DAPI staining of the nucleus and morphometric characteristics. (B) Density of M2-like TAMs determined as CD68+CD163+ cells in the 50 primary tumor microenvironment (P-TME) and 50 M-TME of HGSCs from study group 1. (C) The correlation matrix for M2-like TAMs, natural killer (NK) p46+, lysosomal-associated membrane protein (DC-LAMP)+, CD20+, and CD8+ cells in the tumor nest of patients with HGSC (study group 1). The correlation coefficient is displayed. (D) Overall survival (OS) of 50 patients with HGSC from study group 1 on stratification based on the median density of M2-like TAMs in P-TME and M-TME. Survival curves were estimated by the Kaplan-Meier method, and differences between groups were evaluated using log-rank test. Number of patients at risk and p values are reported. (E) Hierarchical clustering of 1016 transcripts that were significantly changed in 12 M2Hi M-TME patients as compared with their 12 M2Lo M-TME counterparts from study group 1, as determined by RNA sequencing. (F) Relative expression levels of immune cytolytic activity (CYT) index based on transcript levels of granzyme A (GZMA) and perforin (PRF1) in 24 M2Lo and 24 M2Hi P-TME and M-TME samples of HGSC from study group 1, as determined by RNA sequencing. (G) OS of 50 patients with HGSC from study group 1 on stratification based on the median density of M2-like TAMs and immune CYT index. Survival curves were estimated by Kaplan-Meier method, and difference between groups were evaluated suing the log-rank test. Number of patients at risk and p values are reported. ns, not significant.

