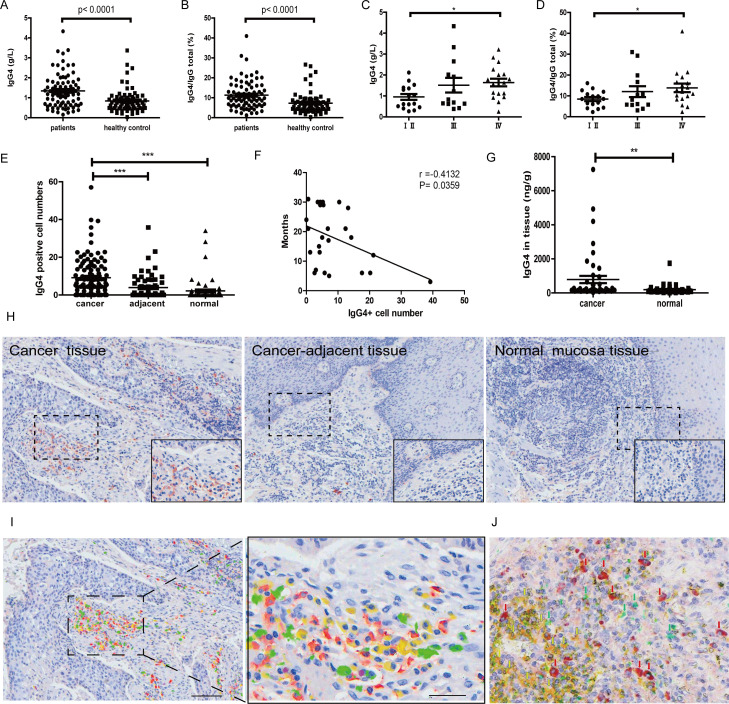
Figure 1.
Significant increase of IgG4 and IgG4:IgGtotal in serum and IgG4-positive B lymphocytes in esophageal cancer. (A) IgG4 in serum of esophageal squamous cell cancer (ESCC) (n=82) was significantly higher when compared with healthy controls (n=70) (p<0.0001). (B) IgG4:IgGtotal ratio in ESCC (n=82) was significantly higher than that in matching healthy adults (n=70) (p<0.0001). (C) IgG4 in stage Ⅳ (n=18) was significantly higher than those in stages Ⅰ and Ⅱ (n=16) (p<0.01). (D) IgG4:IgGtotal in serum of stage IV ESCC (n=18) was significantly higher than those in stages Ⅰ and Ⅱ (n=16) (p<0.05). (E) Scatter diagram of IgG4-positive cell numbers in cancer (cancer), adjacent normal tissue (adjacent) and normal tissues. IgG4-positive lymphocytes in and around the esophageal cancer mass (n=110) are significantly more abundant than those in the adjacent normal tissue (n=60) and normal lymphoid tissues (n=63) (***p<0.001 for both). Increases of IgG4-positive lymphocytes were most abundant in areas of cancer cell proliferation. (F) The increase of IgG4-positive cell numbers was related to the prognoses of the patients. More IgG4-positive cells were associated with worse outcome (p<0.05). (G) IgG4 concentration in cancer tissue (n=46) was significantly higher than that in adjacent normal tissue (n=46) (p<0.01). (H) Immunohistochemistry of IgG4 in esophageal cancer tissues. From left to right are IgG4 in cancer tissues, cancer-adjacent tissue and normal lymphoid tissue (tonsil). It clearly demonstrates that IgG4-positive lymphocytes (red) were markedly increased (left) in comparison with normal lymphoid tissue (right) and with tumor-adjacent normal tissue (middle). Scale bar: 100 µm. (I) Demonstration of four subpopulations of IgG-containing plasma cells with multiple immunostaining (SDS method) in cancer. Each subclass has its own distribution pattern and one plasma cell only produces one subclass of IgG. IgG1: yellow; IgG2: green; IgG3: purple; IgG4: red. (J) On the same tissue section, a triple immunostaining was performed with the SDS method to demonstrate the distribution and relationship among CD3-positive T cells (yellow), IgG1-positive B cells (greens) and IgG4-positive B cells (red). Each cell type has its own distribution, and no overlap between different cell types is observed. SDS, stain-decolorize-stain.

