FIGURE 2.

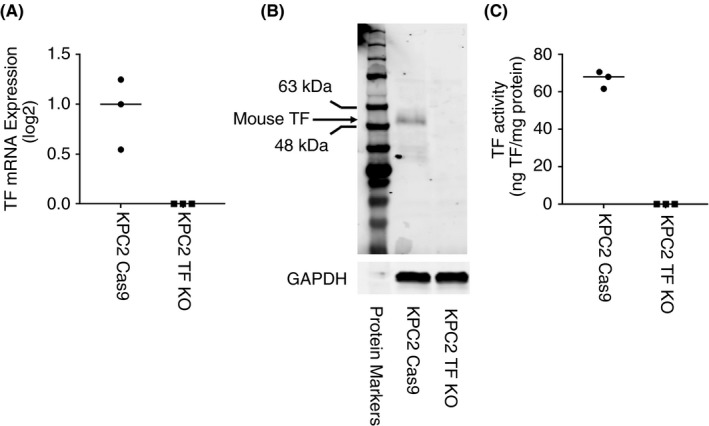
Tissue factor expression in mouse pancreatic cancer cell lines. We used a mouse pancreatic cancer cell line that expresses tissue factor (TF) (KPC2 Cas9) and a TF knockout line (KPC2 TF KO). A, The level of TF mRNA in the 2 cell lines was determined by RT‐PCR. B, The level of TF protein in the 2 cell lines was determined by western blotting using an anti‐mouse TF monoclonal antibody from Abcam ab189483 (1:1000 dilution, final concentration 0.576 μg/mL). Glyceraldehyde 3‐phosphate dehydrogenase (GAPDH) was detected using an anti‐mouse GAPDH antibody (1:1000 dilution, final concentration 0.2 μg/mL). Secondary antibodies were used at a 1:10 000 dilution in blocking buffer. A protein marker is shown on the left of the panel. C, The level of TF activity in the 2 cell lines was determined using a 1‐stage clotting assay. Mean levels of TF mRNA and activity are shown
