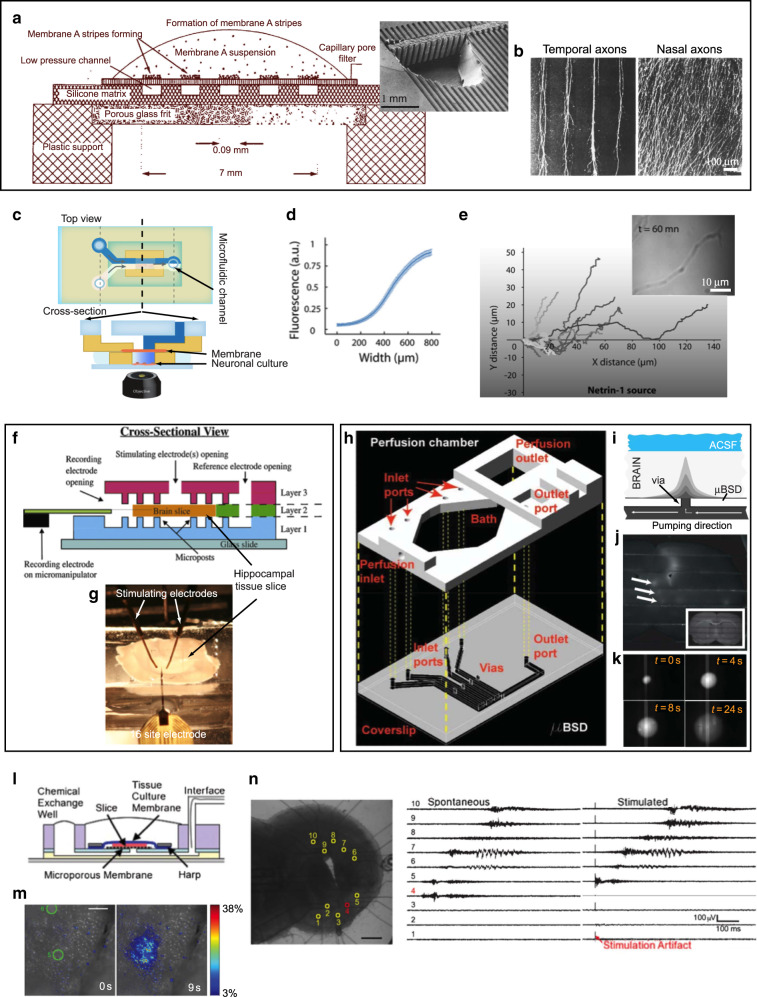
Fig. 1. Microfluidic interrogation of intact neural tissues.
a, b “Stripe assay” for axon guidance. a Cross-sectional schematic of a porous membrane assembled atop a set of micromolded PDMS channels; application of negative pressure to the microchannels with fluid on top of the porous membrane causes hydrodynamic focusing of flow of particulates in suspension (such as cell membrane fragments) towards the stripes defined by the microchannels. Inset: scanning electron micrograph of the PDMS device prior to assembly with the membrane; a hole has been made to reveal the set of vertical channels that provide fluidic access to the horizontal channels. b Optical image of the porous membrane area after a retinal explant is allowed to grow at the edge; the growth of temporal axons is clearly guided by stripes created with cells from the anterior tectum (left), whereas stripes created with cells from the posterior tectum do not guide their growth (right). Adapted with permission from ref. 22. c–e A microfluidic assay for amplification and temporal filtering during gradient sensing by nerve growth cones. c Top and cross-sectional view of the Y-shaped microfluidic device used in the study. A fluidic microcircuit is interfaced via a porous membrane with neuronal cultures in a microwell. Co-flow in the micro-circuit generates a shear-free gradient in the microwell. d The concentration profile at the coverslip surface, measured by confocal microscopy and obtained by averaging profiles measured every 30 s over 1 h. The fluctuations of the relative gradient in the central part of the device are less than 5%. e Example of trajectories of individual growth cones in the Netrin-1 gradient. Inset: Turning and elongation of an axon in the netrin-1 gradient. Adapted with permission from ref. 28. f, g PDMS microfluidic perfusion chamber for electrophysiology. f Cross-section of the device. f Photograph of the setup, showing the stimulating and recording electrodes. Adapted with permission from ref. 33. h–k Microfluidic add-on for the standard electrophysiology chamber setup. h CAD drawing showing how the microfluidic channels are added below the electrophysiology chamber. i Schematic representation of fluid delivery by one of the channels to a brain slice. j Fluorescence micrograph showing a mouse brain slice with delivery of FITC (1 µL dispensed at the inlet port) in spots as indicated by the three white arrows. The inset is a brightfield image of the same slice. k Montage of fluorescence images (taken at various intervals) showing FITC (1 µL dispensed at the inlet port) in channels and delivered to the slice from below. Adapted with permission from ref. 35. l–n Microfluidic microelectrode array. l Cross-section schematic of the device. m Pseudo-colored fluorescence micrograph demonstrating induced local activity (as visualized by calcium imaging) at 9 s after low amplitude electrical stimulation in the spots marked with green (0 s). n Electrical traces (right) of spontaneous and stimulated waves recorded from a slice (right). Adapted with permission from ref. 37

