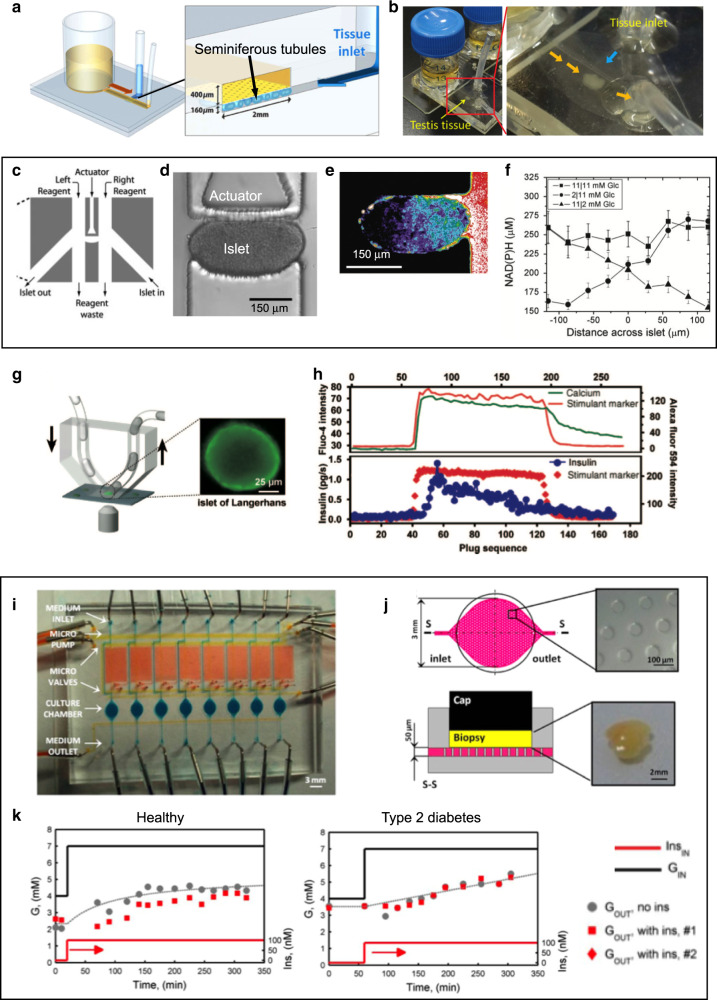
Fig. 4. Microfluidics for interrogating endocrine tissue.
a, b A microfluidic device for trapping and culturing seminiferous tubule tissue from mouse testes. a Schematic of the device; the inset shows a cross-sectional cut of the culture chamber, depicting the position of the porous membrane and the seminiferous tubules. b Top-view photographs of the whole device (left) and detail (right) showing the chamber where the testis tissue is trapped for culturing. Adapted with permission from ref. 99. c–f Microfluidic glucose stimulation of pancreatic islets. c Top-view schematic of the device design showing the actuator channel, the islet in and out channels, two reagent channels, and a reagent waste channel. d Islets are introduced by pressure-driven flow from the “in” channel and trapped by activation of the actuator channel. This actuation does not cause a NAD(P)H rise or internal [Ca+2] oscillations in the absence of glucose stimulation. e A representative islet after exposure to 2-NBDG (a fluorescent glucose analog) in the right stream. f Profile of the NAD(P)H concentrations across an islet exposed to 11/11, 2/11, and 11/2 mM glucose on the left/right side. Adapted with permission from ref. 105. g, h A droplet microfluidic setup for stimulating and recording from pancreatic islets with high temporal and chemical resolution. g Schematic of the setup (inset shows the micrograph of an islet). h Graphs showing the intracellular [Ca+2] response and insulin secretion of a stimulated mouse islet. The upper panel graph shows traces measured by fluorescence microscopy during stimulation (marker: Alexa Fluor 594, red) and recording (intracellular [Ca+2] by fluo-4 indicator, green). The lower panel graph shows traces of the fluorescence intensity of Alexa Fluor 594 marker and the calculated insulin secretion rate, measured with plugs collected during recording. Adapted with permission from ref. 107. i–k A microfluidic device to assess physiological responses of adipose tissue. i Photograph and layout of the device. j Top-view and cross-sectional view for schematic and images over the culture area. k Graphs showing the glucose response to insulin present in normal, but not in diabetic, adipose tissue. Adapted with permission from ref. 118

