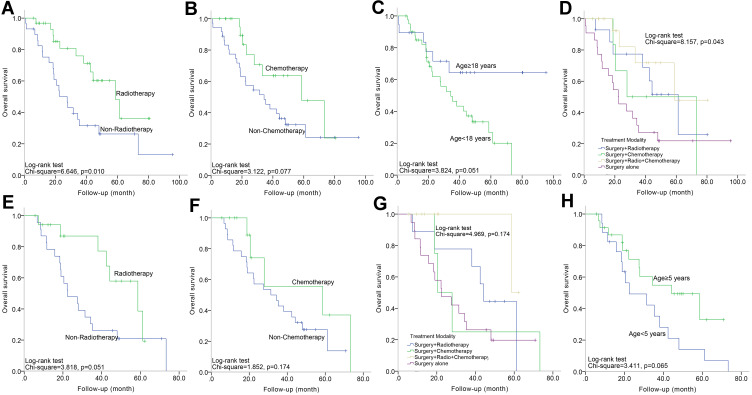
Figure 1.
(A–D) Kaplan–Meier curve analysis (Log rank test) displaying the different OS rates of all patients (n=61) between radiotherapy and non-radiotherapy (A); between chemotherapy and non-chemotherapy (B); between age<18 years and age≥18 years (C); among different four treatment protocols (D). E-H Kaplan–Meier curve analysis (Log rank test) displaying the different OS rates of pediatric patients (n=42) between radiotherapy and non-radiotherapy (E); between chemotherapy and non-chemotherapy (F); among different four treatment protocols (G); between age<18 years and age≥18 years (H).

