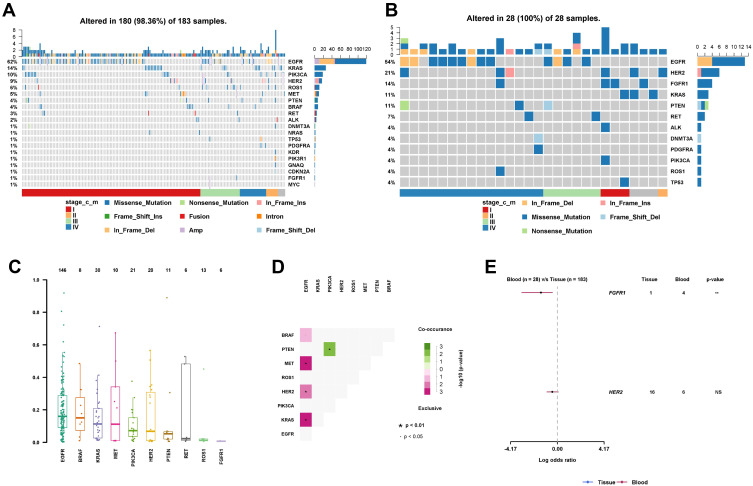
Figure 2.
(A) VAF of the top 10 most frequent mutated genes. (B) A co-occurrence matrix showing which pair of gene mutations were mutually exclusive or coexistent. (C) The differential mutation rate between the tissue and ctDNA. (D) An oncoplot showing the scattering of the somatic mutations with regard to cancer stage and variant type in the tissue samples. (E) An oncoplot showing the scattering of somatic mutations with regard to cancer stage and variant type in the ctDNA samples.

