
FIGURE 2.
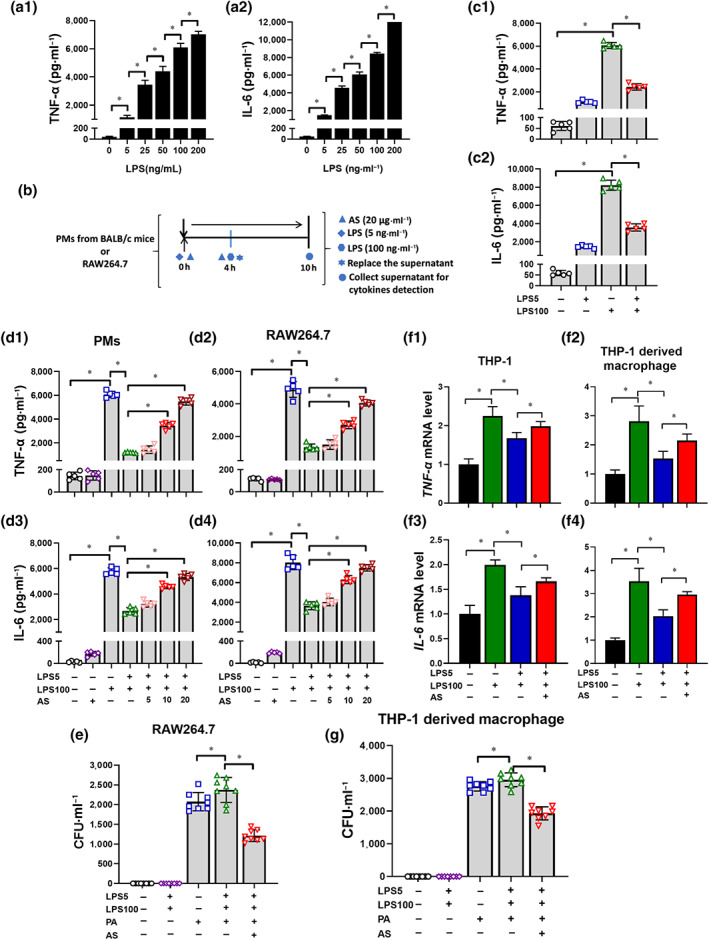
Artesunate (AS) increases pro‐inflammatory cytokines release and bacterial clearance within LPS‐tolerant macrophages (n = 4). (a) LPS increased the release of TNF‐α (a1) and IL‐6 (a2) from peritoneal macrophages (PMs) in a dose‐dependent manner. (b) Schematic diagram of the establishment of the LPS‐tolerant macrophage model. (c) The level of TNF‐α (c1) and IL‐6 (c2) in LPS‐tolerant PMs (n = 5). (d) Effect of AS (5, 10 and 20 μg·ml−1) treatment on the level of TNF‐α (d1, d2) and IL‐6 (d3, d4) in LPS‐tolerant PMs and RAW264.7 cells (n = 5). (e) Effect of AS treatment (20 μg·ml−1) on the bacterial load in LPS‐tolerant RAW264.7 cells (n = 8). (f) Effect of AS (20 μg·ml−1) treatment on the mRNA level of TNF‐α (f1, f2) and IL‐6 (f3, f4) in LPS‐tolerant THP‐1 monocytes and THP‐1 derived macrophages (n = 5). (g) Effect of AS treatment (20 μg·ml−1) on the bacterial load in LPS‐tolerant THP‐1 derived macrophages (n = 8). One‐way ANOVA followed by Tukey's post hoc test; * P < 0.05