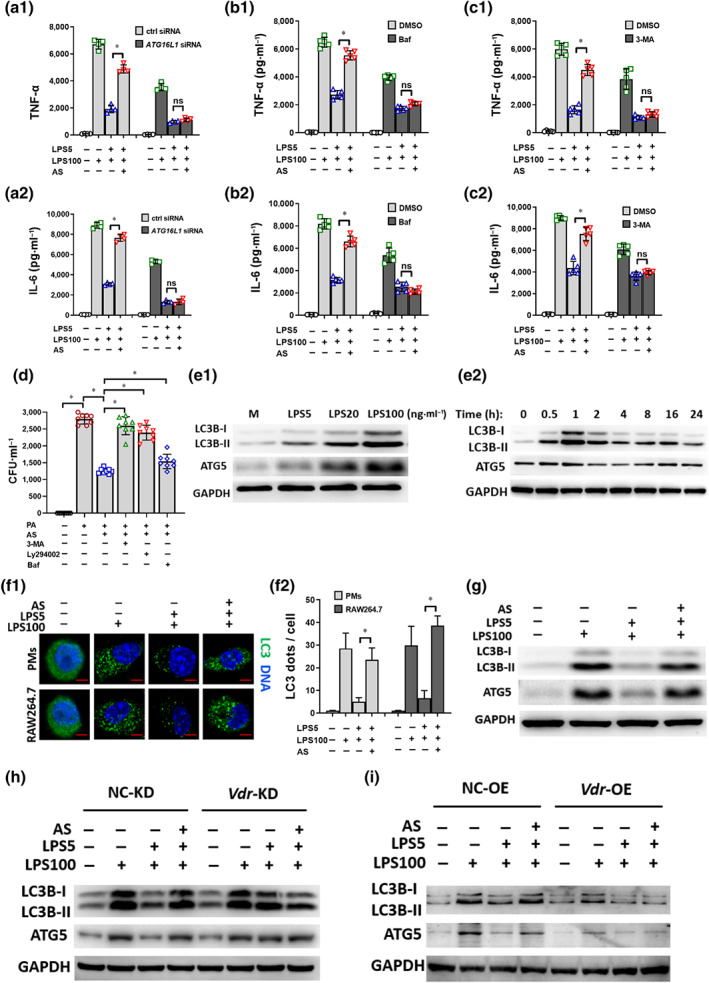
FIGURE 5.

Artesunate's (AS) effect is autophagy‐dependent through VDR in vitro. (a) Effect of Atg16l1 siRNA on TNF‐α (a1) and IL‐6 (a2) levels in LPS‐tolerant RAW264.7 cells treated with AS (n = 5). (b) Effect of bafilomycin (Baf) (10 ng·ml−1) on TNF‐α (b1) and IL‐6 (b1) levels in LPS‐tolerant RAW264.7 cells treated with AS (n = 5). (c) Effect of 3‐MA (5 mM) on TNF‐α (c1) and IL‐6 (c2) levels in LPS‐tolerant RAW264.7 cells treated with AS (n = 5). (d) Effect of 3‐MA, Ly294002 (10 μM), or Baf on the bacterial clearance in LPS‐tolerant RAW264.7 cells treated with AS (n = 8). (e1) LPS increased the protein levels of LC3B‐I, LC3B‐II and ATG5 in a dose‐dependent manner in RAW264.7 cells. (e2) The protein levels of LC3B‐I, LC3B‐II and ATG5 over time in RAW264.7 cells treated with LPS (100 ng·ml−1). The level of expression peaked at 1 h. (f) Representative image of immunofluorescence staining of LC3B in LPS‐tolerant RAW264.7 cells treated with AS (bar = 2 μm). (f1) Relative fluorescent puncta indicating LC3B aggregation were quantified from 100 cells; the number in the medium group was normalized as 1 (f2). (g) The protein levels of LC3B‐II, ATG16L1 and ATG5 in LPS‐tolerant RAW264.7 cells treated with AS. (h) Changes in LC3B‐II, ATG16L1 and ATG5 protein levels in LPS‐tolerant RAW264.7 cells (Vdr‐KD) treated with AS. (i) Changes in LC3B‐II, ATG16L1 and ATG5 protein levels in LPS‐tolerant RAW264.7 cells (Vdr‐OE) treated with AS. One‐way ANOVA followed by Tukey's post hoc test; ns, not significant; * P < 0.05
