
FIGURE 1.
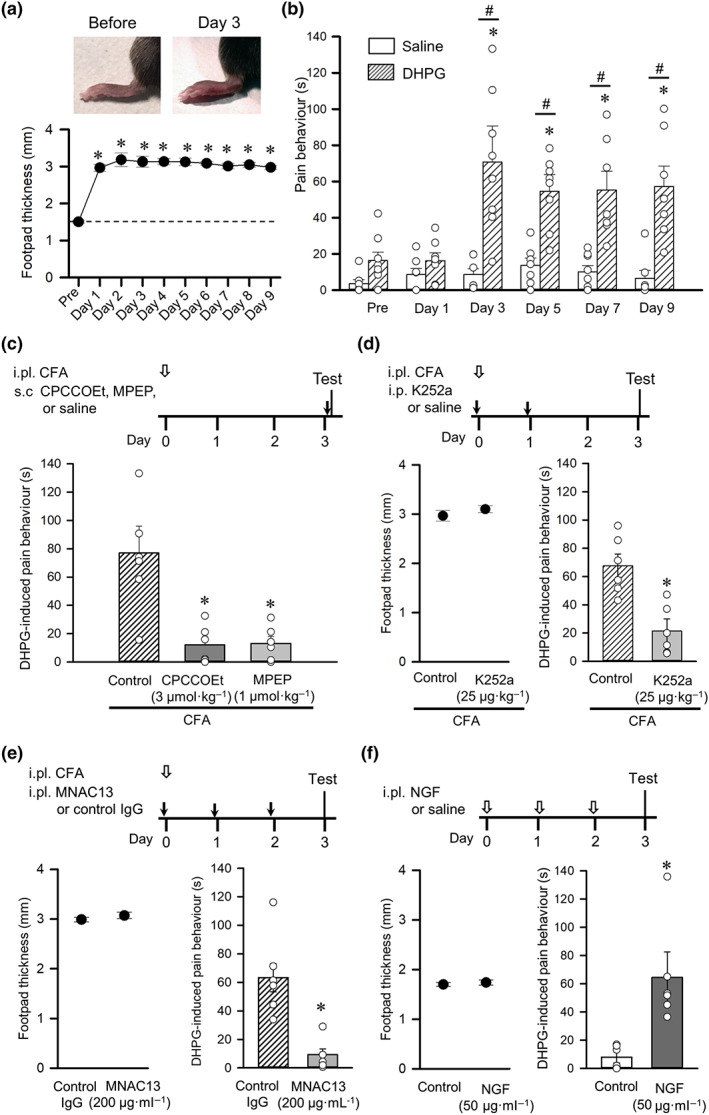
Inflammation facilitates mGlu1/5 receptor agonist‐induced pain behaviour in mice. (a) Time course of footpad thickness after unilateral intraplantar injection of CFA (n = 8). Representative pictures of ipsilateral foot paw before and 3 days after CFA injection (top). *P < 0.05, significantly different from before CFA (Pre); one‐way ANOVA, Dunnett's test. (b) Changes in duration of pain‐related behaviours induced by injection of saline (n = 7) and the mGlu1/5 receptor agonist DHPG (n = 8) into the inflamed footpad. *P < 0.05, significantly different from before CFA (Pre); one‐way ANOVA, Dunnett's test. # P < 0.05, significantly different from the saline group; unpaired Student's t‐test. (c) Timeline of the experimental procedures (top). Intraplantar (i.pl.) injection of CFA at day 0 (open arrow) was followed by tests on day 3 conducted 20 min after subcutaneous (s.c.) injection of the selective mGlu1 receptor antagonist CPCCOEt, the selective mGlu5 receptor antagonist MPEP or saline (control) (black arrow). Effects of CPCCOEt and MPEP on hyperalgesia to DHPG induced by CFA (bottom, n = 6). *P < 0.05, significantly different from control; Kruskal‐Wallis followed by Mann‐Whitney test. (d) Timeline of experimental procedures (top). Tests were conducted 3 days after intraplantar injection of CFA (open arrow). Intraperitoneal (i.p.) injections of the Trk inhibitor K252a or saline (control) were performed at day 0 and day 1 (black arrows). Effect of K252a on foot oedema (bottom left) and on hyperalgesia to DHPG (bottom right) induced by CFA (n = 6). *P < 0.05, significantly different from control; unpaired Student's t‐test. (e) Timeline of experimental procedures (top). Tests were conducted 3 days after intraplantar (i.pl.) injection of CFA (open arrow). Intraplantar injections of MNAC13 or the control IgG into ipsilateral footpads were performed at day 0, day 1, and day2 (black arrows). Effect of MNAC13 on foot oedema (bottom left) and on hyperalgesia to DHPG (bottom right) induced by CFA (n = 6). *P < 0.05, significantly different from control; unpaired Student's t‐test. (f) Timeline of experimental procedures (top). Tests were conducted after repeated intraplantar injections of NGF or saline (control) (open arrows). Effect of NGF on footpad thickness (bottom left) and on DHPG‐induced pain behaviour (bottom right) (n = 6). Each column or closed circle and vertical bar represent mean ± SEM. Open circles indicate values of six to eight mice. *P < 0.05, significantly different from the control group; unpaired Student's t‐test