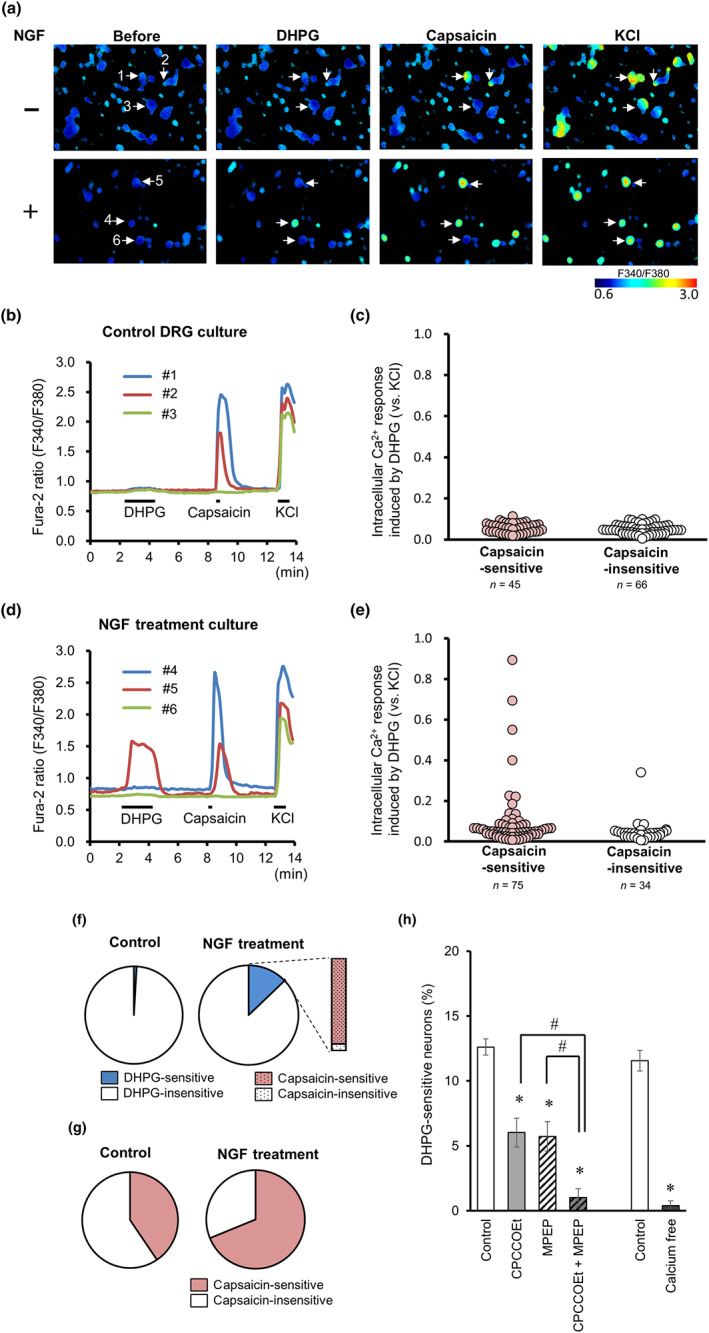
FIGURE 2.

NGF increases the proportion of nociceptive DRG neurons responding to DHPG. (a) Representative images of the F340/F380 ratio before and after perfusion of DHPG (100 μM), capsaicin (0.3 μM), and KCl (50 mM) using Fura‐2 AM dye in the control (upper) and NGF‐treated DRG culture (lower). (b and d) Representative time courses of F340/F380 ratios for Fura‐2 AM in three independent cells numbered in panel (a) (coloured lines) in the control (b) and NGF‐treated (d) cultures. DHPG, capsaicin, and KCl were perfused for 2 min, 30 s, and 1 min, respectively, as indicated by horizontal bars. (c and e) Intracellular calcium elevations induced by DHPG in capsaicin‐sensitive and capsaicin‐insensitive neurons of the control (c) and NGF‐treated (e) DRG cultures. DHPG‐induced responses were normalized with maximal response to KCl. (f) Pie charts represent the proportions of DHPG‐sensitive neurons (blue) in the control (left) and NGF‐treated (right) DRG cultures. The column indicates the proportion of capsaicin‐sensitive neurons in DHPG‐sensitive neurons after NGF treatment. (g) Proportions of capsaicin‐sensitive neurons in the control (left) and NGF‐treated (right) DRG cultures. (h) Percentages of DHPG‐sensitive neurons in NGF‐treated cultures. DHPG‐induced responses were recorded in the presence of CPCCOEt (mGlu1 receptor antagonist) and/or MPEP (mGlu5 receptor antagonist), or in the absence of extracellular calcium (n = 8). Each column and vertical bar represent means ± SEM. *P < 0.05, significantly different from control, # P < 0.05, significantly different from the CPCCOEt group or the MPEP group; one‐way ANOVA, Tukey's test (for comparison of the CPCCOEt and MPEP groups) or unpaired Student's t‐test (for the comparison of the calcium‐free group)
