Figure 4.

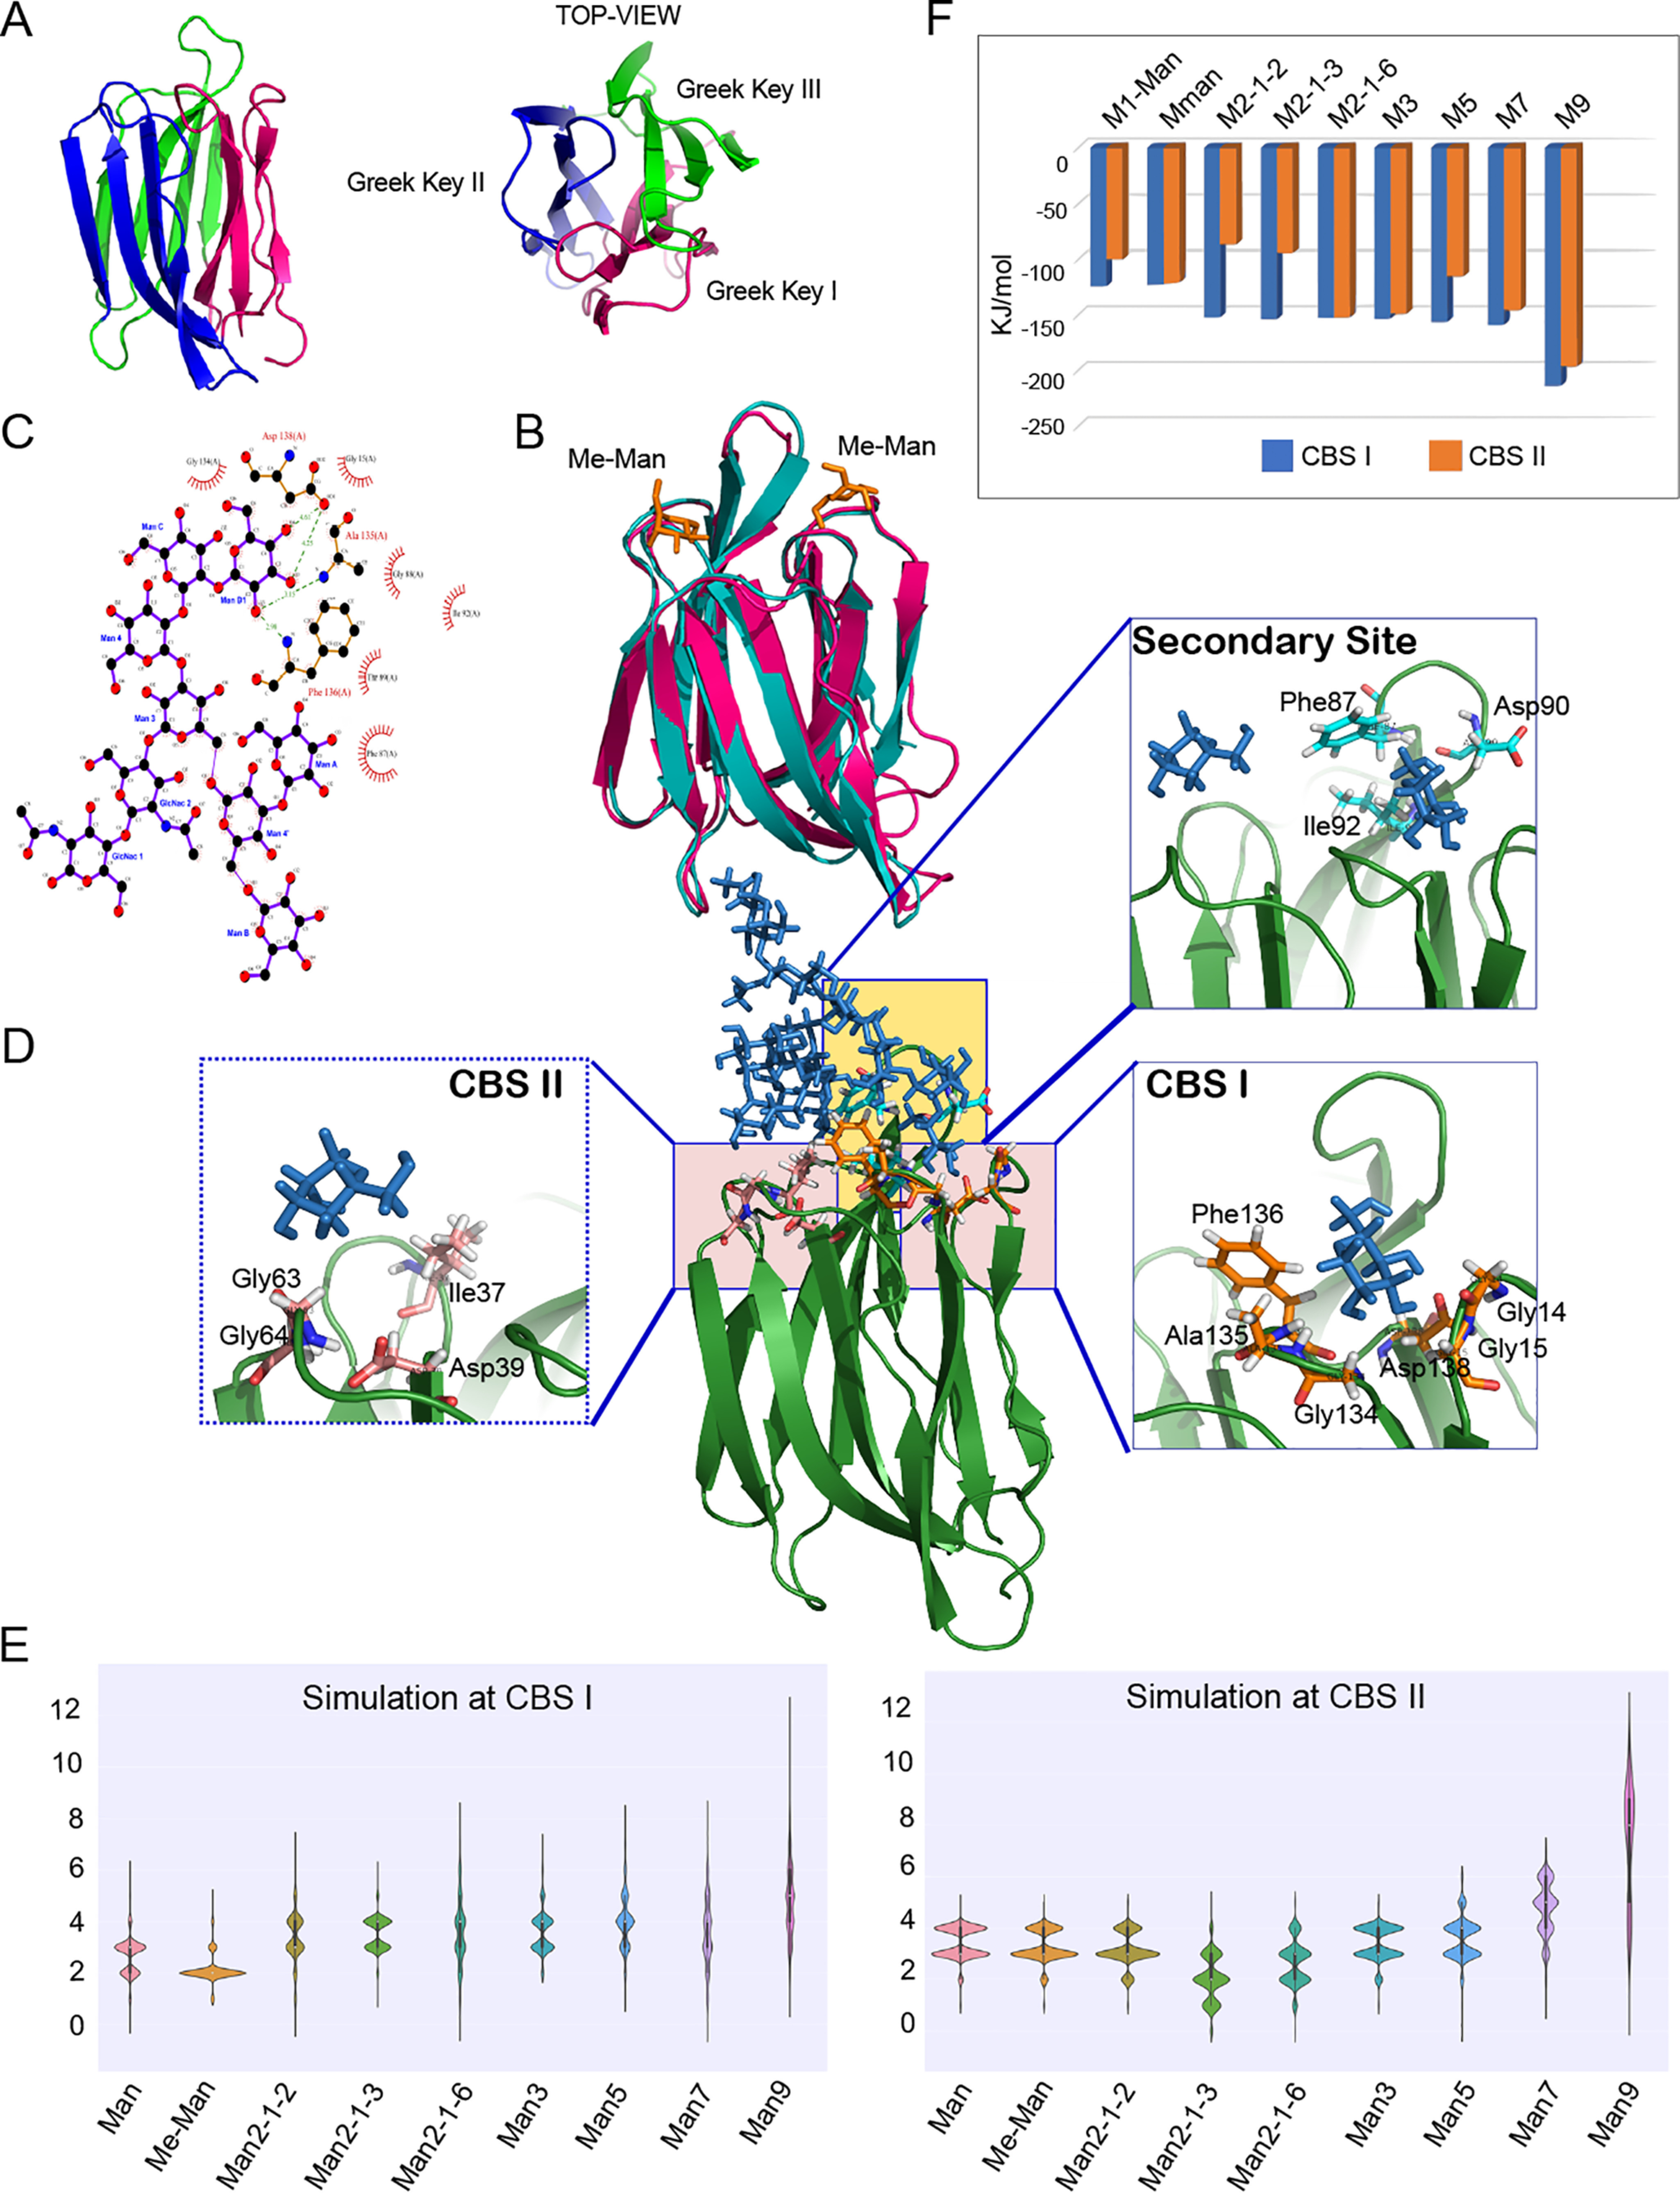
Molecular modeling and MD simulation of glycan-binding modes of horcolin. A, overall fold of horcolin, shown in a cartoon representation with the three Greek keys (β1–2 + β11–12; β3–6; β7–10) color-coded magenta, blue, and green, respectively, and the 12 β-strands numbered. B, superposition of horcolin and BanLec in complex with methyl-α-d-mannopyranoside (PDB ID 1X1V). horcolin is represented in a magenta cartoon, BanLec in teal, and Me-α-Man as orange sticks. C, results from Ligplot analysis of the HR-Man7 complex, where the dashed green lines indicate hydrogen bonds and the half-moon indicates van der Waals interactions. D, schematic representation of the interactions of the glycan Man7 with HR where the glycan is shown in stick representation and the protein in cartoon. Shown in the inset is the residue-level interaction of the glycan Man7 (ball and stick representation) with the residues in the CBS I and II and the common secondary site (stick representation). E, summary of the hydrogen bonds for the nine complexes at binding sites CBS I and CBS II shown as the average number of hydrogen bonds indicated as violin plots. F, results from MM/PBSA analysis for the complexes at binding sites CBS I and II shown in blue and orange, respectively.
