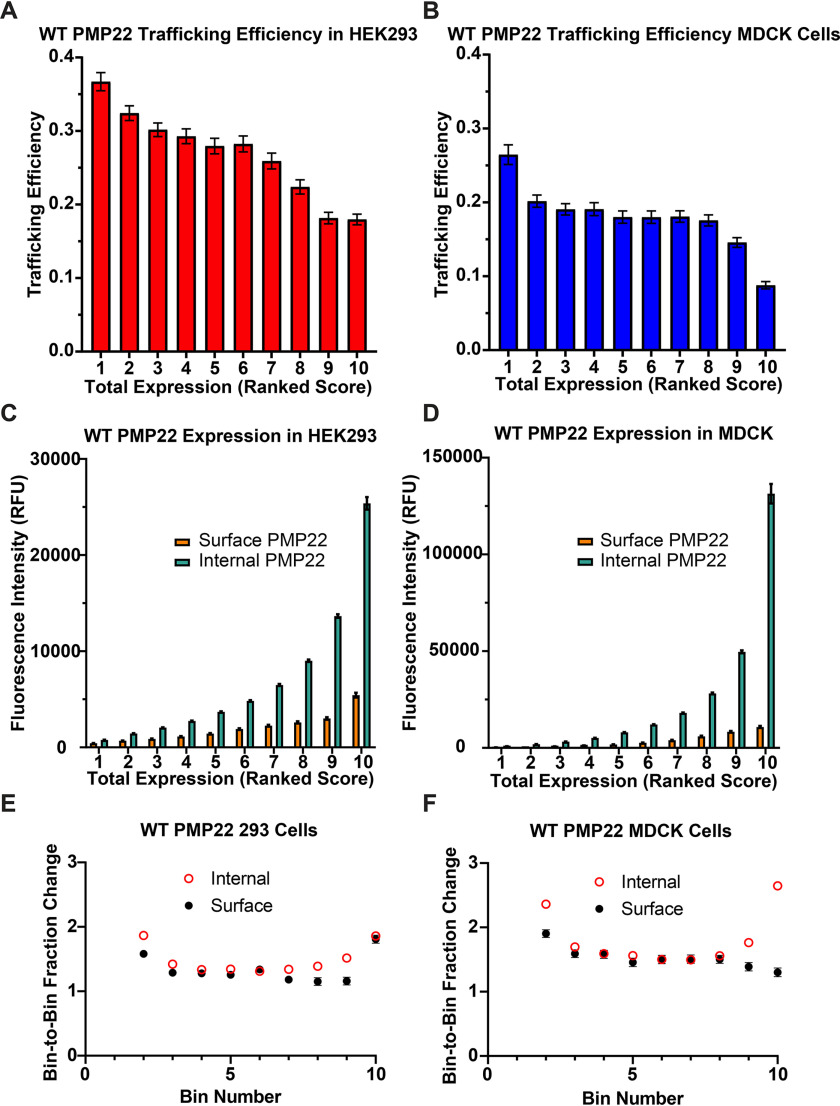
Figure 2.
WT PMP22 trafficking efficiency in individual cells versus total PMP22 expression. A and B, PMP22 trafficking efficiency was measured for each of 7500 individual transiently transfected HEK293 cells (A) or transiently transfected MDCK cells (B), each from three independent biological replicates. The cells were placed into 10 bins representing 750 cells each based on total PMP22 expression. The mean trafficking efficiency ± 95% CI is plotted for each bin. The data for B were obtained from a data set originally reported in Ref. 17. C and D, trafficking efficiency values plotted in A and B were deconvoluted, and the mean levels of cell surface PMP22 (orange) and of internal PMP22 (green) ± 95% CI are plotted for each bin. E and F, the fraction change of relative fluorescence between each bin (bin 2/bin1, bin 3/bin2 … bin10/bin 9) was calculated for both cell surface (black circles) and internal (open red circles) PMP22 shown in C and D. Mean fraction change is reported ± 95% CI (for values with no visible error bars, the error was too small to be represented).

