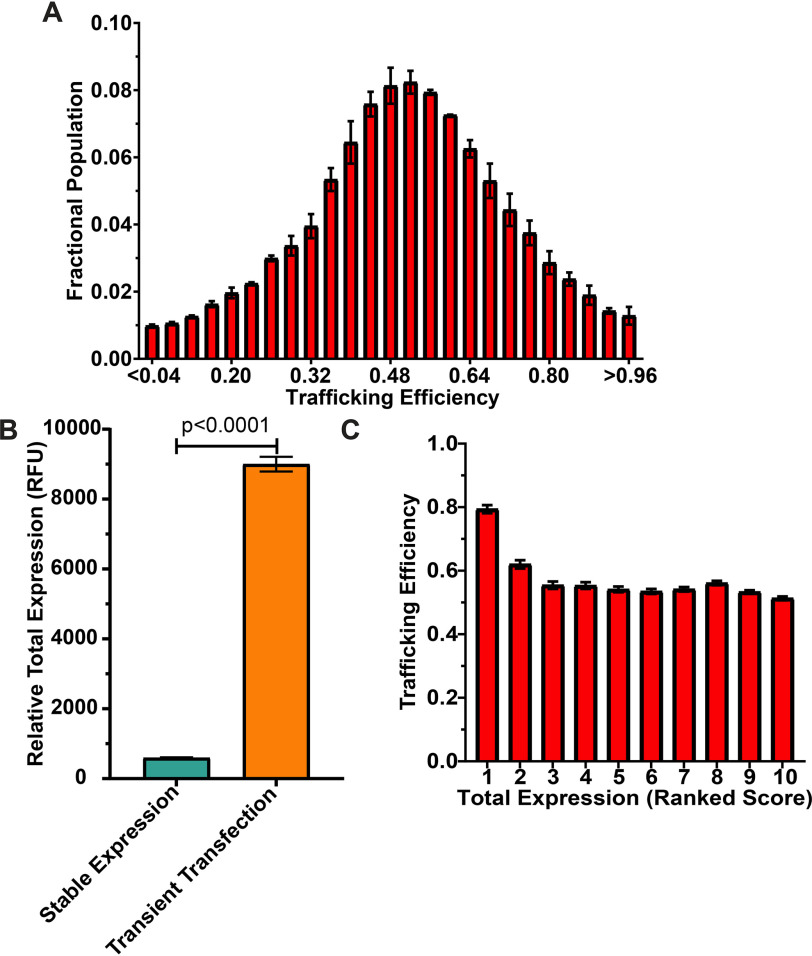
Figure 4.
Trafficking efficiency for HEK293 cells stably expressing WT PMP22. A, population distribution of WT PMP22 trafficking efficiency measured in individual cells from two independent biological experiments with >11,000 cells measured per replicate. Fractional populations for each bin were calculated for each replicate, and the means ± S.E. are shown. For comparison to transiently transfected HEK293 cells, see Fig. 1B. B, average total expression (means ± 95% CI) of WT PMP22 (calculated as RFU) in 22,960 individual HEK293 cells stably expressing WT PMP22 from two biological replicates (aqua) and 7500 individual HEK293 cells that were transiently transfected (three biological replicates, orange). Student's t test was used for statistical analysis. Fractional populations for each bin were calculated for each replicate, and the means ± S.E. are shown. C, PMP22 trafficking efficiencies for the 22,960 individual WT PMP22 stable expressor cells were placed into 10 bins of 2296 cells each based on total PMP22 expression levels. The mean trafficking efficiency ± 95% CI is plotted for each bin.

